Fig. 2.
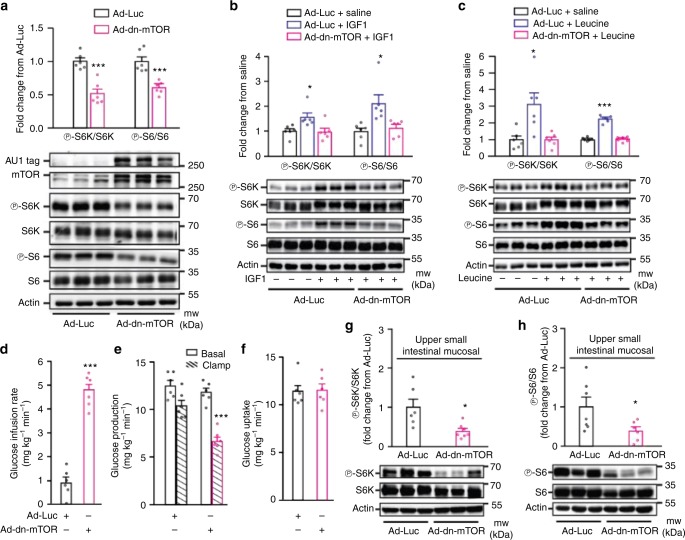
Molecular inhibition of upper small intestinal mTOR lowers glucose production. a–c Representative western blot and quantitative analysis of phosphorylated S6K and S6 protein expression normalized to their respective total in PC12 cells infected with Ad-dn-mTOR and treated with saline (a), IGF1 (b), or leucine (c) compare to cells infected with Ad-Luc and treated with saline. AU1, tag protein for mTOR construct; actin, loading control. a ***p < 0.001 as calculated by unpaired t-test (n = 6 for each group); b, c *p < 0.05 or ***p < 0.001 vs. all other groups as determined by ANOVA with Tukey’s post hoc test (n = 6 for each group). d–f The glucose infusion rate (d), glucose production (e), and glucose uptake (f) during the clamp in HFD-fed rats with upper small intestinal Ad-Luc (n = 6) or Ad-dn-mTOR (n = 6). ***p < 0.001 vs. Ad-Luc as calculated by unpaired t-test. g, h Quantitative analysis and representative western blot of phosphorylated S6K (g) and S6 (h) protein expression normalized to their respective total in the upper small intestinal mucosal tissue of HFD rats with either Ad-Luc (n = 6 for S6k, and 7 for S6) or Ad-dn-mTOR (n = 7 for S6k, and 6 for S6). *p < 0.05 vs. Ad-Luc as calculated by unpaired t-test. Actin, loading control. Values are shown as mean ± s.e.m.

