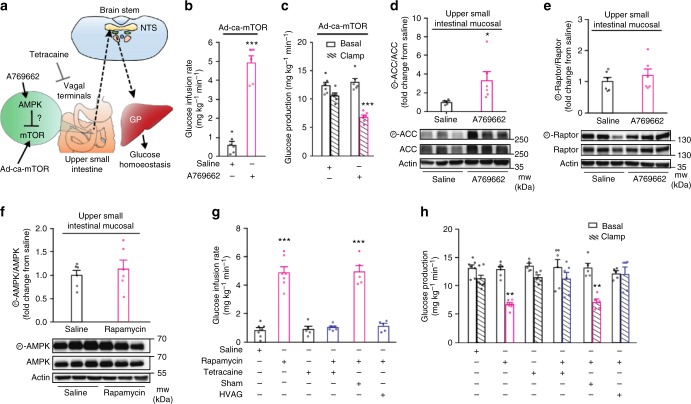
Fig. 4.
Inhibition of upper small intestinal mTOR activates a gut–brain axis to lower hepatic glucose production. a Schematic representation of working hypothesis. b, c Glucose infusion rate (b) and glucose production (c) during the clamps in HFD rats infected with upper small intestinal Ad-ca-mTOR and infused with upper intestinal A769662 or saline. ***p < 0.001 vs. saline; determined by unpaired t-test (n = 6 for each group). d, e Quantitative analysis and representative western blot of phosphorylated ACC (d) and raptor (e) protein expression in the upper intestinal mucosa of Ad-ca-mTOR infected HFD rats infused with upper intestinal saline or A769662. Actin, loading control. *p < 0.05 vs. saline as calculated by unpaired t-test (n = 5 for saline, and 6 for A769662 in ACC, and 6/group in raptor). f Western blot of phosphorylated AMPK protein expression in the upper small intestinal mucosa of HFD rats infused with upper intestinal saline or rapamycin. Actin, loading control. *p < 0.05 vs. saline as calculated by unpaired t-test (n = 6 for each group). g, h Glucose infusion rate (g) and glucose production (h) during clamps in HFD rats infused with upper small intestinal saline (n = 7), rapamycin (n = 7), tetracaine (n = 5), rapamycin + tetracaine (n = 6), rapamycin + sham (n = 5) or hepatic vagal branch vagotomy (HVAG) (n = 5). **p < 0.01 or ***p < 0.001 vs. saline, tetracaine, tetracaine + rapamycin, and HVAG + rapamycin; determined by ANOVA with Tukey’s post hoc test. Values are shown as mean ± s.e.m.

