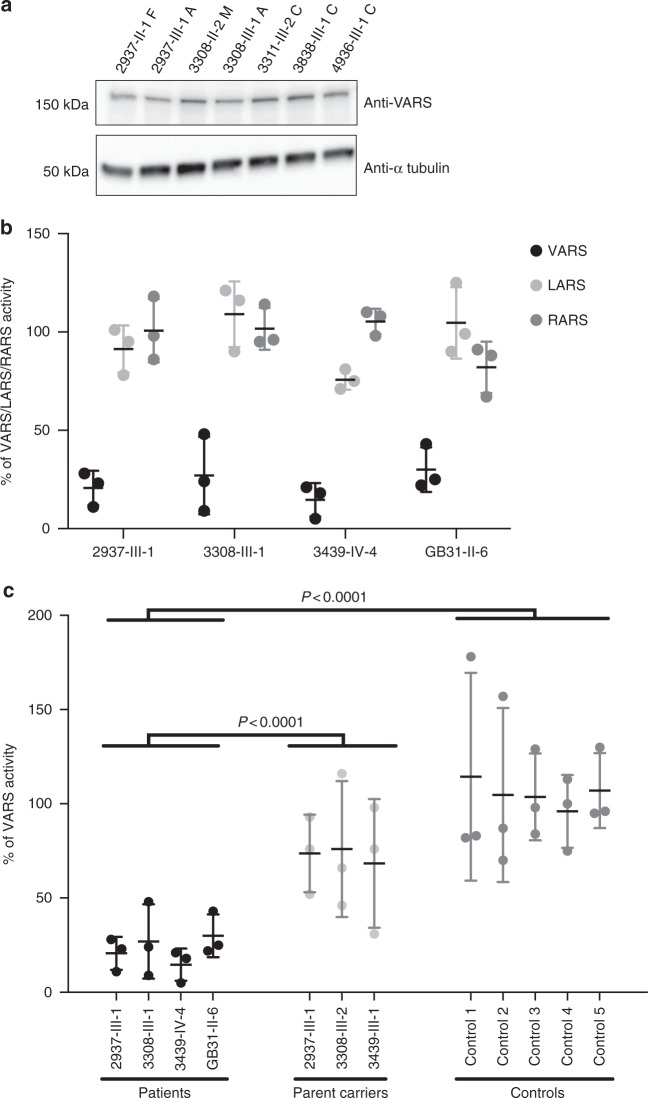
Fig. 3.
VARS patient cells show normal VARS protein level, but reduced enzymatic ARS activity. a Western blot of patient or control cells showing retained VARS protein level in affected individuals (2937-III-1A and 3308-III-1A), carrier parents (2937-II-1F and 3308-II-2M), and controls (3311-III-2C, 3838-III-1C, and 4936-III-1C). b VARS, LARS (leucine ARS) and RARS (arginine ARS) aminoacylation activity. VARS activity was specifically reduced in patient cells, normalized to control cells at 100% (from n = 3 replicates, error bars = S.E.M.). c VARS activity in patients compared with carrier parents and controls. Black: patients, light gray: parents of affecteds (obligate carriers of the VARS mutation), dark gray: healthy controls (from n = 3 replicates, error bars = S.E.M). Differences between patients and controls or carriers were calculated based upon the average of the group (P < 0.0001 for both comparisons, One tailed Student’s t-test). Full gel in Supplementary Fig. 2

