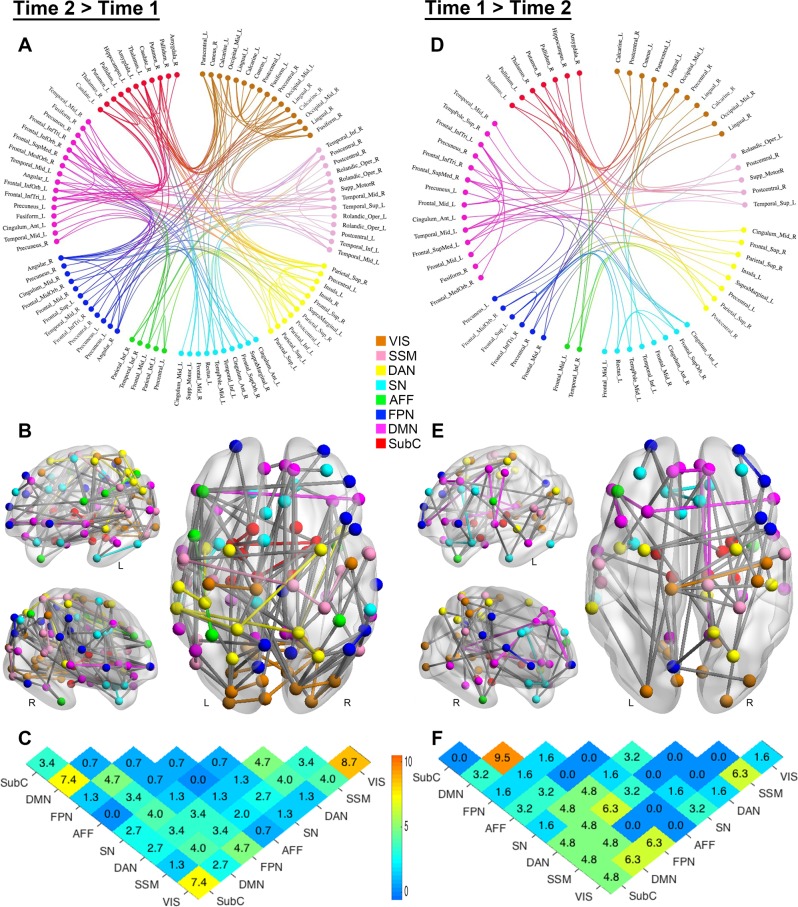
Fig. 2. Developmental changes in structural connectome (main effect of time).
a, b, d, e Anatomical arrangement of nodes and edges identified by NBS exhibiting increases (a, b; 149 edges linking 94 nodes) and decreases (d, e 63 edges linking 61 nodes) in normalized streamlines (adjusted for the interregional fiber length) over time. Regions of interest in connectograms are grouped per functional divisions18, with the node color denoting the functional assignment of each region. Anatomical assignments are based on the Automated Anatomical Labeling atlas (http://www.gin.cnrs.fr/en/tools/aal-aal2/). The location of the node in b and e represents the MNI centroid coordinates of each parcellated region. c, f Distribution of edges based on the functional divisions they interconnect. Values in the matrices represent relative proportions (percentage), calculated as the ratio between the frequency of edges linking each pair of divisions, and the total number of edges exhibiting increases and decreases over time, respectively. L = left; R = right; Mid = middle; Inf = inferior; Tri = pars triangularis; Orb = orbital; Sup = superior; Oper = operculum; VIS = visual network; SSM = sensory-somatomotor network; DAN = dorsal attention network; SN = salience/ventral attention network; AFF = affective network; FPN = frontoparietal network; DMN = default-mode network; SubC = subcortical

