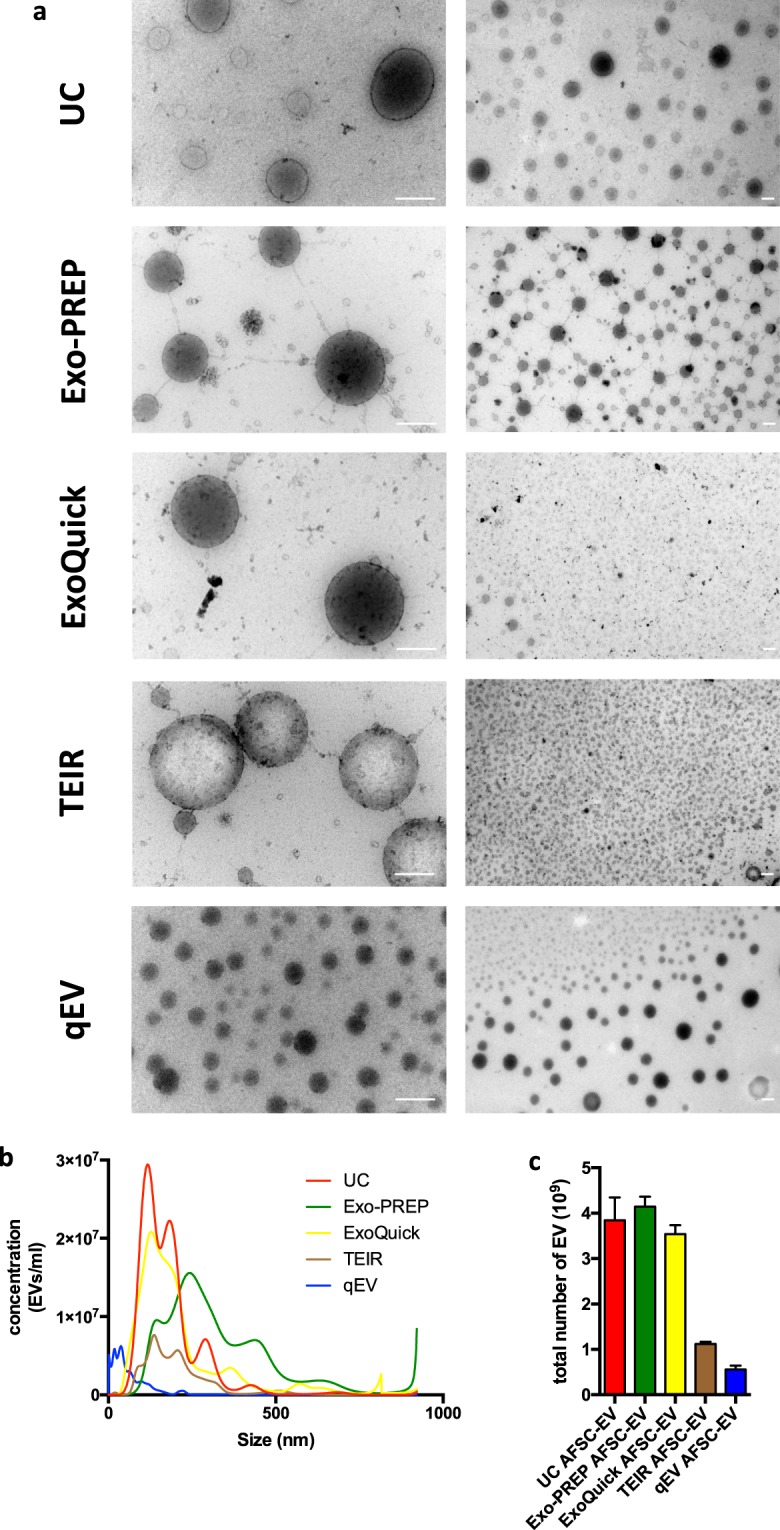
Figure 1.

Comparison of EV morphology, size distribution, and yield with different isolation techniques. (a) Representative photos of AFSC-EV morphology analyzed by TEM; the two different magnifications highlight morphology of individual EVs at near fields (left column) and a population of EVs at far fields (right column) Scale bar = 200 nm. (UC = Ultracentrifugation; TEIR = Total Exosome Isolation Reagent). B: Representative plot of the average size distributions of AFSC-EVs isolated with the different techniques visualized using Nanoparticle Tracking Analysis. Data are representative of eight videos of AFSC-EV preparations. X-axis = size distribution (nm), y-axis = concentration (particles/ml). (c) Total particle yield calculated as the area under the curve from (b) of each AFSC-EV preparation.
