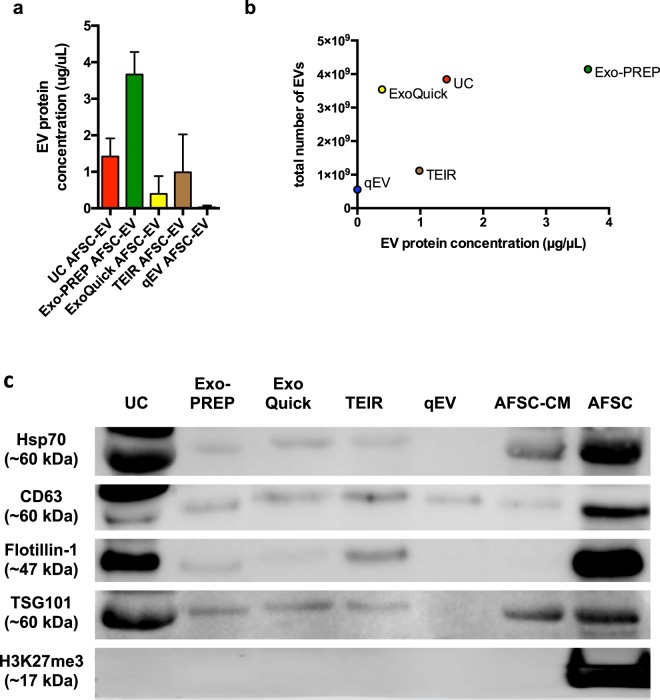
Figure 2.
Comparison of AFSC-EV protein content and EV markers. (a) Protein quantification of AFSC-EV preparations using the Pierce Bradford assay. Data are shown as mean ± SD n = 3. No difference was found between preparations isolated with UC, ExoQuick and TEIR. AFSC-EV preparations isolated using qEV had lower protein content than those isolated using Exo-PREP (p < 0.05). (b) Correlation analysis between total number of particles analyzed with Nanoparticle Tracking Analysis (Fig. 1c) and EV protein concentration (μg/μL) in each preparation of AFSC-EVs obtained by different isolation techniques [p = 0.25, r = 0.6 (95% CI −0.56 to 0.97)]. (c) Expression of canonical EV markers Hsp70, CD63, Flotillin-1, and TSG101 obtained by Western blot analysis for the different isolation techniques. All AFSC-EV isolation techniques showed no evidence of residual cellular debris, as evidenced by a lack of H3K27me3 protein expression. AFSCs (parent cells) and AFSC-conditioned medium (AFSC-CM; the initial starting material from which all techniques were derived), are shown as positive controls. Representative photo from n = 3 replicate analyses.

