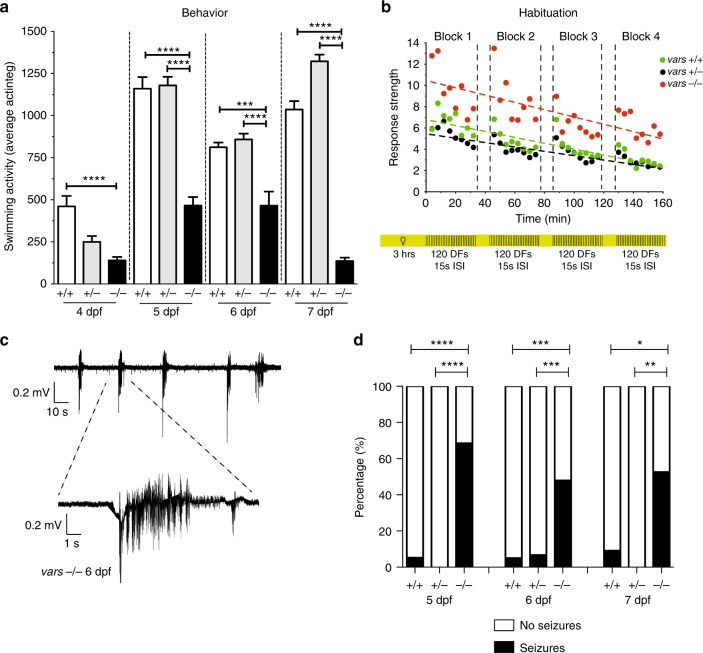
Fig. 4.
vars−/− larvae show cognitive deficits and spontaneous seizure like behavior. a Behavioral activity (average total movement) of vars+/+ (n = 58), vars+/− (n = 108), and vars−/− (n = 58) larvae from 4 to 7 dpf expressed in actinteg units. Values are mean of three separate experiments. b Habituation assay performed on 6 dpf vars+/+ (n = 19), vars+/− (n = 47), and vars−/− (n = 30) larvae was composed of four blocks with 120 DFs with 15 s ISI (regions with black and yellow stripes), alternated by 10 min of light (yellow areas). The linear slopes between the actinteg responses were calculated (dotted lines) and compared between the different genotype groups (green circles—vars+/+, black circles—vars+/−, and red circles—vars−/−). DF dark flashes, ISI interstimulus intervals. Values are mean of two separate experiments. c Representative recording from optic tectum of 6 dpf vars−/− larva displaying polyspike discharges. Top trace represents typical pattern of epileptiform activity. Bottom trace shows magnification of the epileptiform event. d Percentage of larvae exhibiting spontaneous electrographic activity recorded from 5 dpf vars+/+ (n = 19), vars+/− (n = 31), and vars−/− (n = 35), 6 dpf vars+/+ (n = 20), vars+/− (n = 30) and vars−/− (n = 48) and 7 dpf vars+/+ (n = 12), vars+/− (n = 13) and vars−/− (n = 19) larvae. Abnormal brain activity was observed in 68.57% (24/35) 5 dpf vars−/−, 5.26% (1/19) 5 dpf vars+/+, 47.62% (23/48) 6 dpf vars−/−, 5% (1/20) 6 dpf vars+/+, 6.67% (2/30) vars+/−, 52.63% (10/19) 7 dpf vars−/− and 8.33% (1/12) 7 dpf vars+/+. In a and b one-way ANOVA with Tukey’s multiple comparisons test was used. In d—Fisher’s exact test was used. Significant values are noted *p < 0.05, **p < 0.01, ***p < 0.001, and ****p < 0.0001. Error bars represent SD

