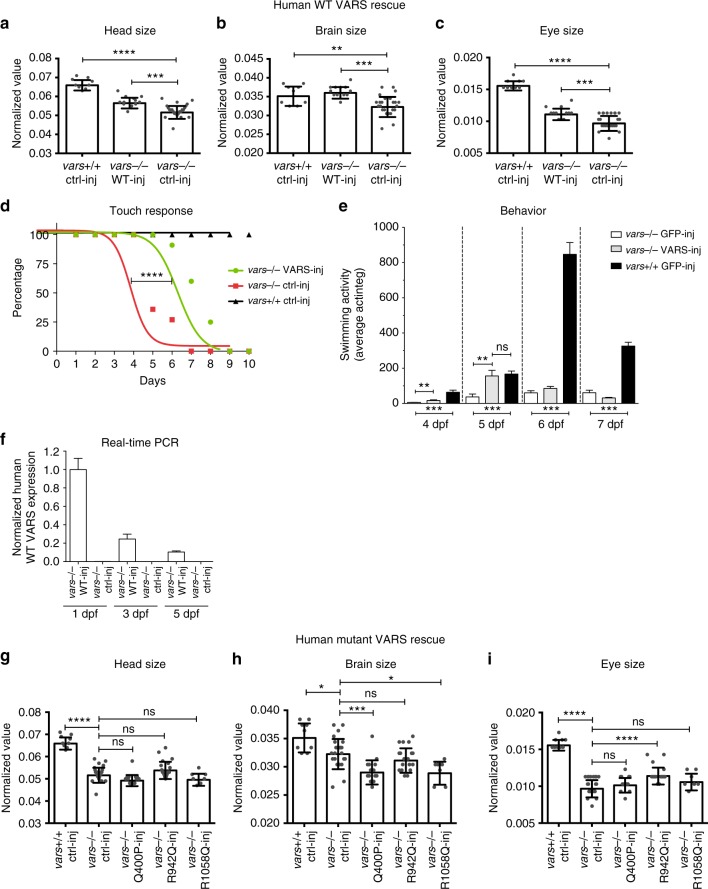
Fig. 5.
Wild-type human VARS mRNA partially rescues early zebrafish phenotype, whereas mutated constructs do not. a–c Comparison of the individual measurements for head size a, brain size b, and eye size c for WT human VARS-injected vars−/− larvae (n = 12). GFP-injected vars+/+ larvae (n = 9) were used as a positive control, whereas GFP-injected vars−/− larvae (n = 24) served as a negative control. Values are mean of three separate experiments. d Curves illustrating the evolution of touch response during the life span of vars−/− larvae injected with WT human VARS (n = 12) and GFP mRNA (n = 11) (negative control). vars−/− GFP-injected larvae were used as a positive control. e Average total movement of WT human VARS-injected (n = 10) and GFP-injected (n = 9) vars−/− larvae from 3 to 7 dpf. vars+/+ GFP-injected larvae (n = 14) were used as a control. f RT-qPCR data demonstrating expression levels of injected human WT VARS in vars−/− larvae at 1, 3, and 5 dpf. At 3 and 5 dpf there was 24.55% and 10.42% WT VARS mRNA left, respectively, in comparison to 1 dpf. Values are mean of three separate experiments performed in triplicate. g–i Comparison of the individual measurements for head size g, brain size h, and eye size i for human mutated Q400P (n = 15), R942Q (n = 18) and R1058Q (n = 7) VARS-injected vars−/− larvae. GFP-injected WT larvae (n = 9) were used as a positive control, whereas GFP-injected vars−/− larvae (n = 24) served as a negative control. Values are mean of three separate experiments. In a–c and g–i one-way ANOVA with Tukey’s multiple comparisons test was used; in d—log-rank (Mantel-Cox) test; in e—unpaired t-test. Significant values are noted *p < 0.05, **p < 0.01, ***p < 0.001, and ****p < 0.0001. Error bars represent SD

