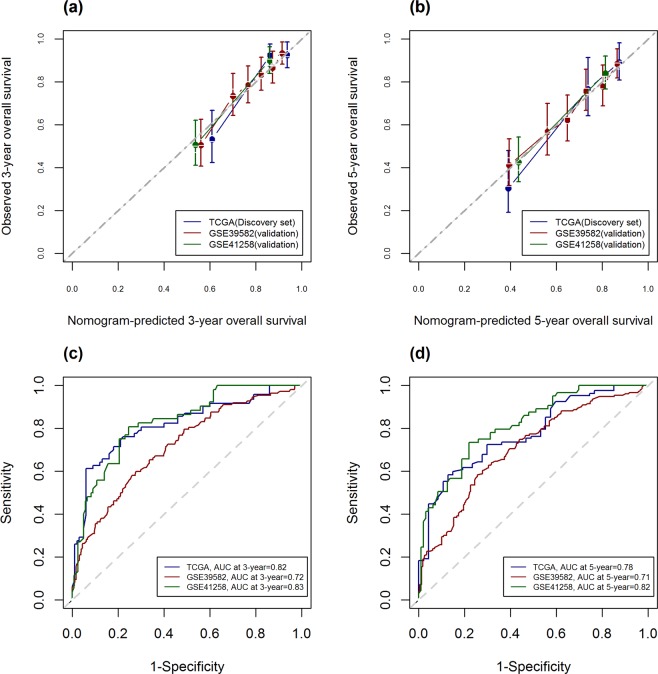
Figure 6.
Calibration curve for nomogram-predicting (a) 3-year and (b) 5-year overall survival. The X-axis is nomogram-predicted survival probability and the Y-axis is observed survival probability respectively. Red, green and blue solid lines represent the performance of the nomogram relative to the 45-degree line, indicating perfect prediction. Receiver operating characteristic curves assessing the discriminating ability of the nomogram in predicting (c) 3-year and (d) 5-year overall survival.

