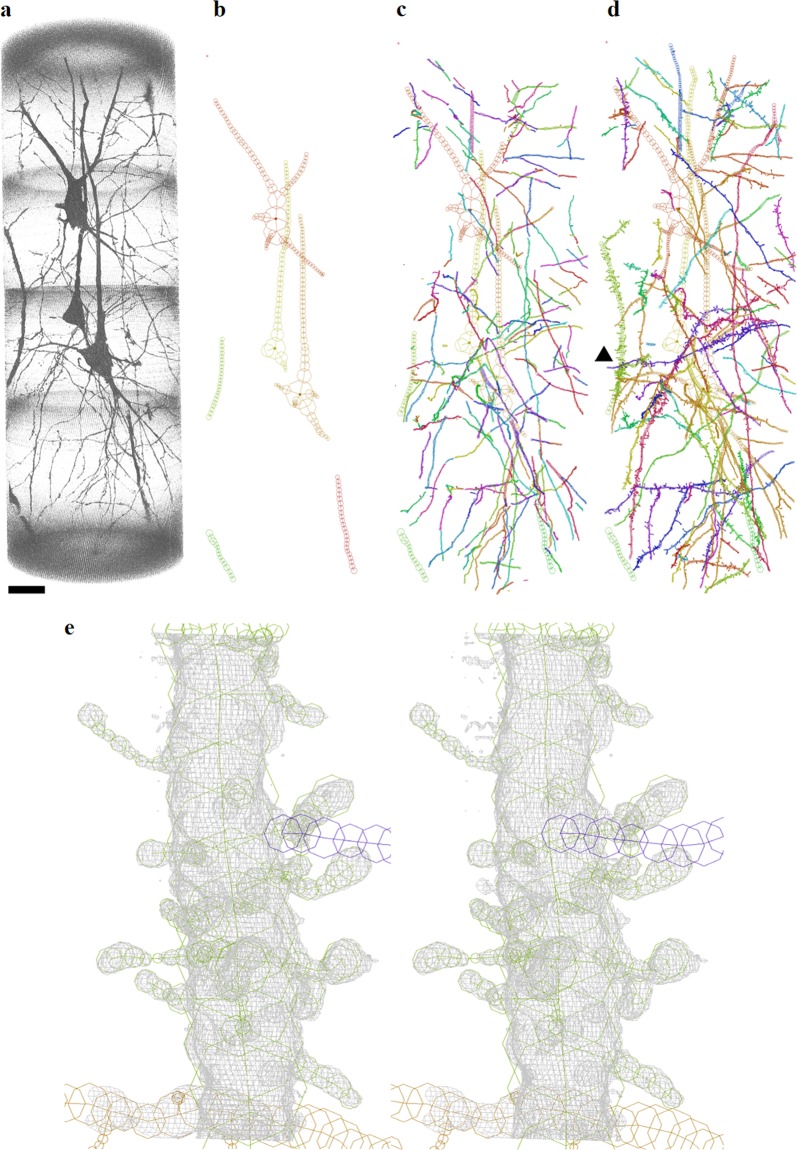
Fig. 1. Three-dimensional visualization of cerebral cortex neurons and their models represented with Cartesian coordinates.
The pial surface is toward the top. The three-dimensional image was rendered with VGStudio (Volume Graphics, Germany). The models were drawn using MCTrace60. Structural constituents of the model are color-coded. Nodes composing each constituent are indicated with circles. Dots indicate soma nodes. a Rendering of dataset N2C of the control N2 tissue. Voxel values of 500–1600 were rendered with the scatter HQ algorithm. Scale bar: 20 μm. b Initial model. Structures of somata and thick neurites were built manually in order to mask them in the subsequent automatic model generation. c Automatically generated model of the tissue structure. Neurites were searched by calculating the gradient vector flow61 throughout the image. The neurites found in the search were then traced using a three-dimensional Sobel filter62. d The computer-generated model was manually examined and edited according to the method used in protein crystallography. The obtained working model was refined with conjugate gradient minimization. The geometric parameters were calculated from the three-dimensional Cartesian coordinates of the refined model. e Stereo drawing of a spiny dendrite indicated with the arrow head in d. The structure is superposed on a three-dimensional map of the observed image. The map drawn in gray is contoured at 2.5 times the standard deviation (2.5 σ) of the image intensity with a grid size of 96.6 nm

