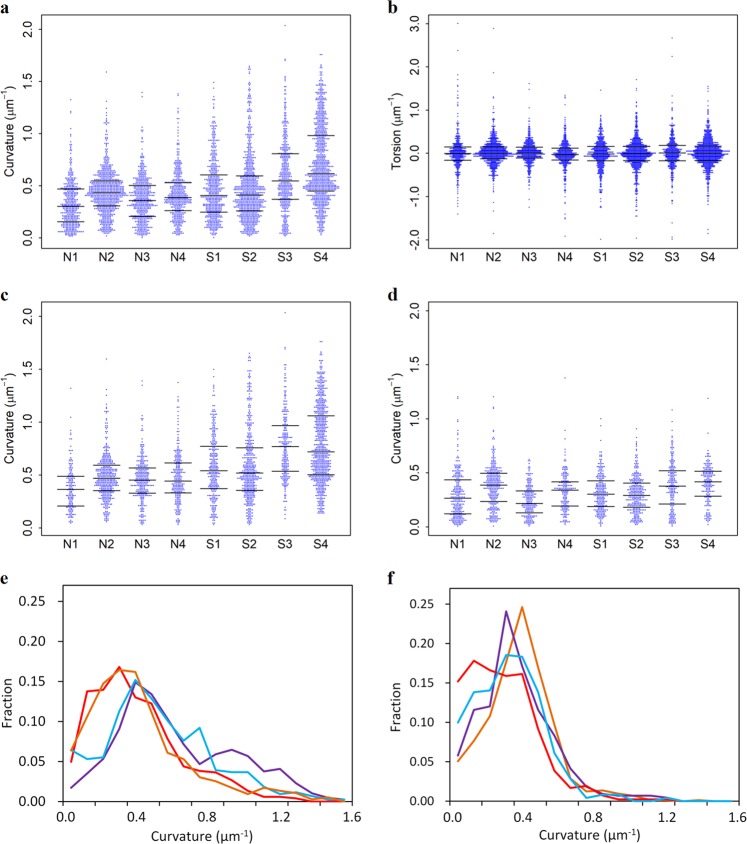
Fig. 2. Geometric analysis of neurites.
a Distribution of neurite curvature. Quartiles are indicated with bars. b Distribution of neurite torsion. c Distribution of curvature of orphan neurites without soma in the viewing field. d Distribution of curvature of neurites whose somata were visualized within the image. e Relative frequency of neurite in each 0.1 μm−1 bin of curvature. The schizophrenia S1 case is plotted in red, S2 in orange, S3 in cyan, and S4 in purple. f Neurite curvature of the control N1 case is plotted in red, N2 in orange, N3 in cyan, and N4 in purple

