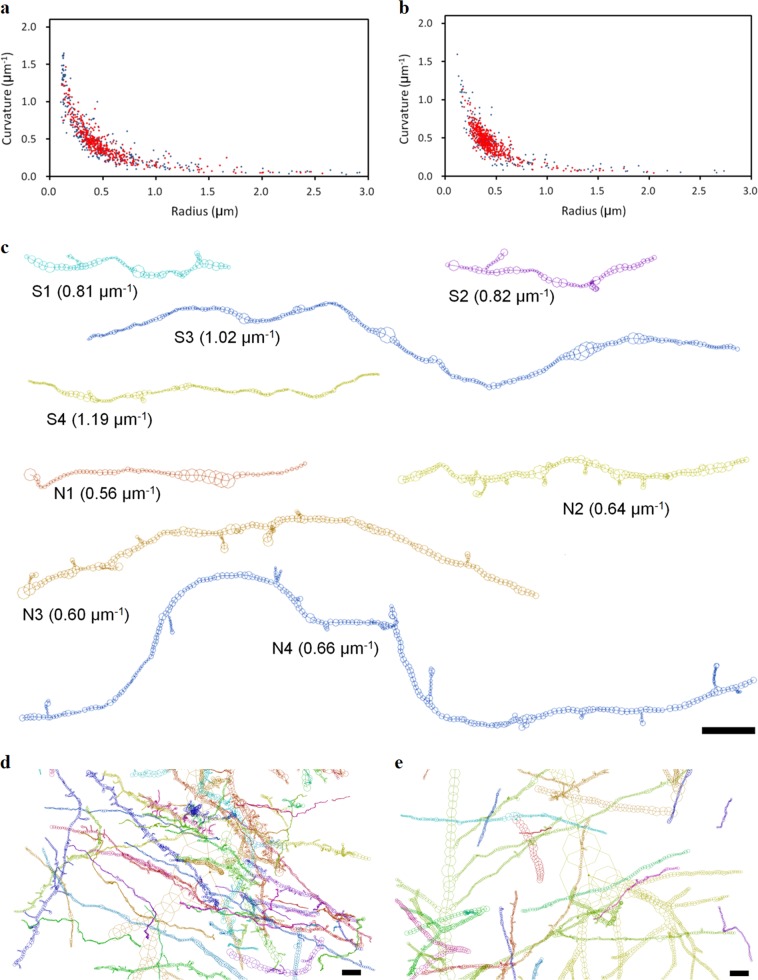
Fig. 3. Neurites in schizophrenia and control cases.
a Scatter plot of curvature and radius of neurites in the schizophrenia S2 case. b Scatter plot of control N2 case. The horizontal axis represents the mean radius of the neurite as a fiber. Thin neurites are on the left, and thick ones are on the right. The vertical axis represents the mean curvature of the neurite trajectory. Spiny dendrites are indicated with red dots and smooth neurites with blue. Neurites with mean radii larger than 3 μm are omitted. c Neurite segments showing median curvature in the top quartile of each case. Mean curvature of each neurite is shown in parenthesis. The neurite of N1 is a branch on an apical dendrite of a pyramidal neuron. Others are orphan neurites whose somata are not visualized within the image. d Schizophrenia S4A structure. e Control N4A structure. Panels d and e were produced by placing the soma node of the largest pyramidal neuron at the figure center. The pial surface is toward the top. Structures are color-coded. Scale bars: 5 μm

