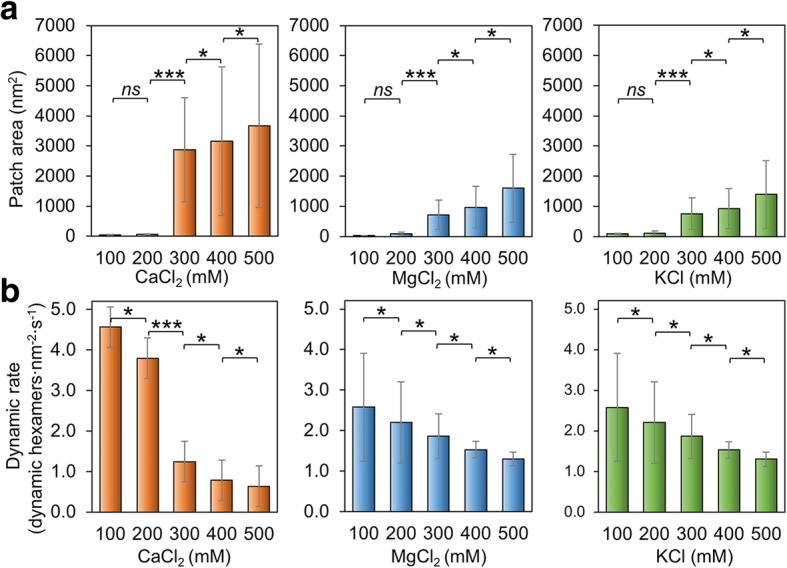
Fig. 3.

Effects of salt concentration on the self-assembly of Hoch_5815. a The mean patch areas measured by AFM under a range of 100–500 mM CaCl2, MgCl2, and KCl (n = 50). The rise in salt concentration resulted in increased patch sizes. Significant changes in patch area were observed between 200 and 300 mM (***p < 0.001, *p < 0.05, ns not significant, two-way ANOVA). b The mean rates of dynamic events determined from high-speed AFM image series under a range of 100–500 mM CaCl2, MgCl2, and KCl (n = 50). Each 100 mM change in salt concentration led to a significant change in the rate of dynamic events (***p < 0.001, *p < 0.05, ns not significant, two-way ANOVA)
