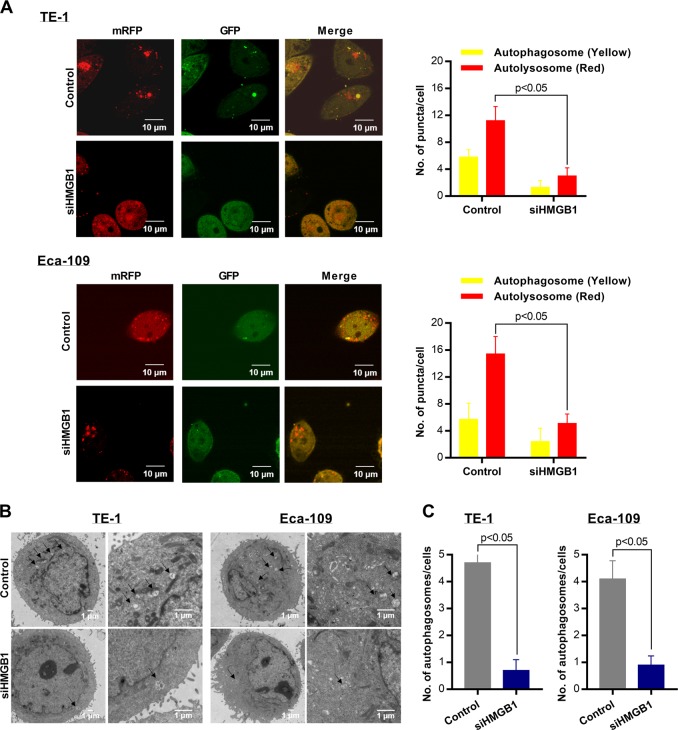
Fig. 4. HMGB1 knockdown suppresses the level of autophagy in ESCC cells.
a ESCC cells stably transfected with mRFP-GFP-LC3 and treated with siHMGB1. Laser confocal fluorescence microscopy analyses (left) and puncta-based quantification (right) for autophagosomes and autolysosomes (t test). In the merged image, yellow puncta indicate autophagosomes, while red puncta indicate autolysosomes. b TEM microscopic images of autophagosomes in TE-1 and Eca-109 transfected with siHMGB1. c Average number of autophagosomes per cell in TE-1 and ECA-109 cells (t test)

