FIG 5.
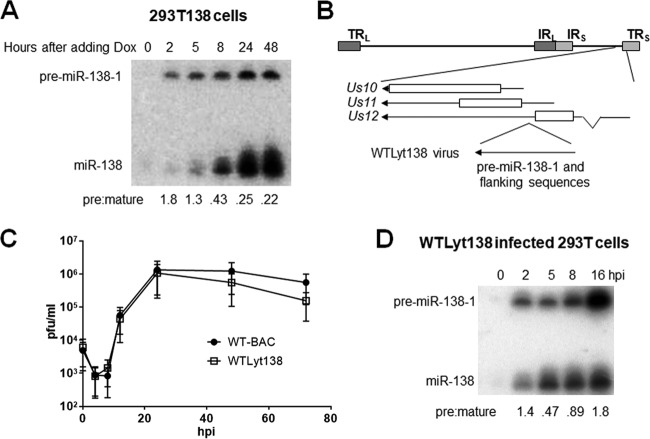
miR-138 expression in lentivirus-transduced cells and in cells infected with recombinant HSV-1 expressing miR-138. (A) 293T cells were stably transduced with an inducible pre-miR-138-1-expressing lentivirus, resulting in the 293T138 cell line. After 1 μg/ml of Dox was added, cells were harvested at the times indicated at the top of the image and analyzed by Northern blot hybridization for miR-138 expression. Pre/mature ratios calculated following band quantification are shown at the bottom. This experiment was performed twice. (B) Genomic location of inserted pre-miR-138-1-expressing sequences. The HSV-1 genome is depicted as a horizontal line at the top with long repeat sequences (TRL and IRL) and short repeat sequences (IRS and TRS), which are shown as dark and light gray boxes, respectively. An expanded view of the insertion location is shown below the horizontal line, with bars representing protein coding sequences, arrows representing transcripts and gene names provided to the left. As shown at the bottom, pre-miR-138-1 and flanking sequences were inserted between coding sequences of Us11 and Us12, resulting in a recombinant virus designated WTLyt138. (C) Replication kinetics in Vero cells (MOI = 0.02). Each point represents the average of titers from three biological replicates (the experiment was performed three times), and the vertical bars represent standard deviations. (D) 293T cells were infected with WTLyt138 (MOI = 5). The image shows an autoradiogram of the Northern blot of RNAs isolated from the cells at the hours postinfection (hpi) indicated at the top of the panel, hybridized for miR-138. Positions of pre-miR-138-1 and miR-138 are indicated to the left. Pre/mature ratios calculated following band quantification are shown at the bottom. This experiment was performed three times; additionally, similar results were obtained at two time points in Fig. 7F.

