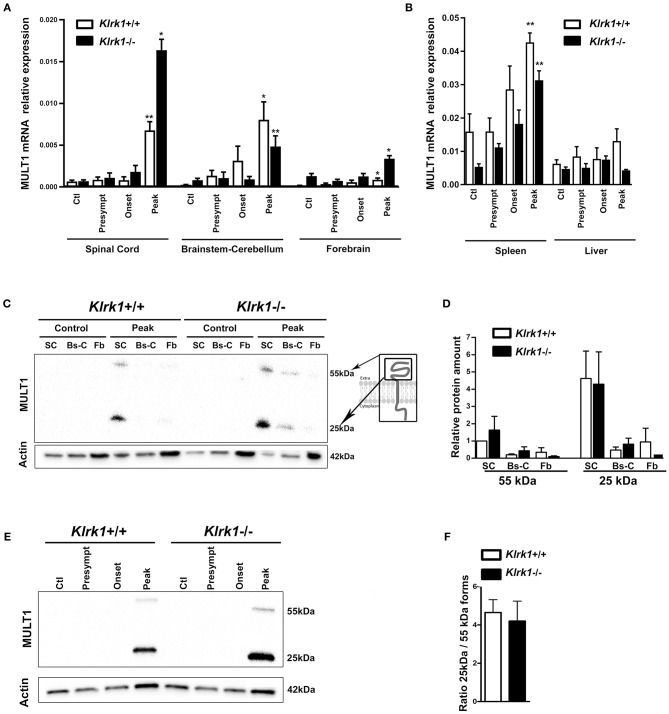
Figure 3.
Upregulation of MULT1 at the mRNA and protein levels in the CNS during EAE. Quantification of MULT1 expression in organs from Klrk1−/− (black bars) and wild type (Klrk1+/+; white bars) mice either injected with CFA-PBS as control (Ctl) or subjected to active EAE and sacrificed at pre-symptomatic (presympt), onset or peak stage of disease. (A) MULT1 relative mRNA expression in the spinal cord (SC), brainstem-cerebellum (Bs-C) and forebrain (Fb). Mean ± SEM n = 4–8. Kruskal-Wallis test and Dunn's test analysis within the same genotype group; statistical differences in Klrk1+/+ group: spinal cord and brainstem-cerebellum: peak vs. ctl, presympt, or onset; forebrain peak vs. control. Statistical differences within Klrk1−/− group: spinal cord peak vs. control, presymptomatic or onset stage; brainstem-cerebellum peak vs. presymptomatic; forebrain peak vs. presymptomatic. *p < 0.05; **p < 0.01. (B) MULT1 relative mRNA expression in spleen and liver. Kruskal-Wallis test and Dunn's test analysis within the same genotype group; statistical differences in spleen for both Klrk1+/+ and Klrk1−/− groups: peak vs. ctl. **p < 0.01. (C–F) Western blot analysis of MULT1 and actin levels in different CNS areas from Klrk1−/− and Klrk1+/+ mice at different disease stages. (C) One representative western blot of spinal cord (SC), brainstem-cerebellum (Bs-C) and forebrain (Fb) from control mice and mice at EAE peak; cartoon illustrating full and cleaved forms of MULT1. (D) Quantification of 55 kDa and 25 kDa forms as relative expression compared to actin at disease peak in Klrk1−/− (black bars) and Klrk1+/+ (white bars) mice; levels in Klrk1+/+ spinal cord at disease peak defined as 1. Mean ± SEM n = 4–6. (E) One representative western blot of spinal cord from Klrk1−/− and Klrk1+/+ mice treated as control or EAE at different disease stages. (F) Ratio of the 25kDa on 55 kDa forms in the spinal cord at peak of disease for both genotypes. Klrk1−/− (black bars) and Klrk1+/+ (white bars). Mean ± SEM n = 4–6.

