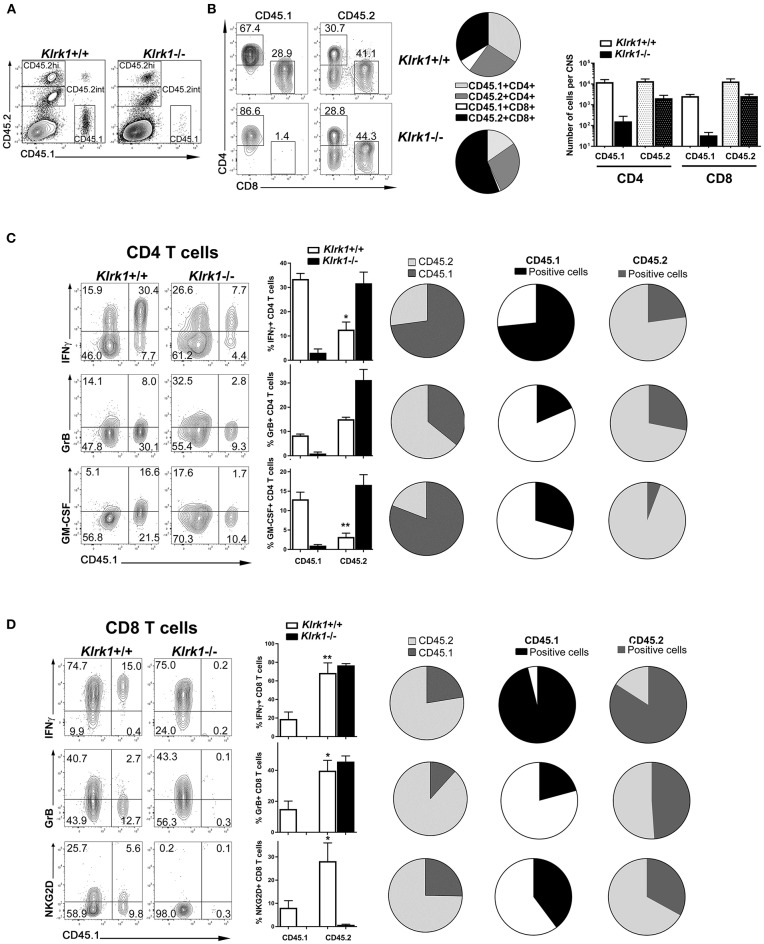
Figure 7.
CNS-infiltrated endogenous CD8 lympocytes exhibit effector functions. Leukocytes from MOG-immunized B6-CD45.1 were reactivated in vitro and then adoptively transferred into CD45.2-expressing Klrk1−/− and Klrk1+/+ mice. Recipients were sacrificed on day 25 and organs collected for flow cytometry analysis. Cells from donor mice were CD45.1 whereas cells from recipients express the standard C57BL/6 CD45.2 marker. Flow data representative of 3–4 mice per group. (A) Representative contour plots of CNS cells in Klrk1−/− and Klrk1+/+ recipient mice showing CD45.1+ cells (donor cells) or CD45.2+ cells (endogenous cells) amongst all single and living cells. (B) Representative contour plots showing CD45.1+ or CD45.2+ gated cells for CD4 and CD8 T cell detection in Klrk1−/− and Klrk1+/+ recipients. Pie charts illustrate the proportion of CNS-infiltrating CD3 T cells that were either CD45.1+CD4+, CD45.2+CD4+, CD45.1+CD8+, and CD45.2+CD8+ in Klrk1+/+ and Klrk1−/− mice. Number of cells per CNS (spinal cord and brain pooled from each individual mouse) for CD4 and CD8 T cells that expressed either CD45.1 or CD45.2. Mean + SEM n = 3. (C,D) Representative contour plots of CNS cells gated either on CD4 (C) or CD8 (D) T cells in Klrk1−/− and Klrk1+/+ recipients showing donor cells (CD45.1+) or endogenous cells (CD45.1 negative) producing IFNγ, granzyme B (GrB) or GM-CSF or expressing NKG2D. Bar graphs illustrate mean ± SEM n = 3–4 individual mice of one representative experiment. Statistical differences for percentage of IFNγ producing CD4 T cells in Klrk1+/+: CD45.1 in vs. CD45.2 *p < 0.05; percentage of GM-CSF producing CD4 T cells in Klrk1+/+: CD45.1 in vs. CD45.2 **p < 0.01; for percentage of IFNγ producing CD8 T cells in Klrk1+/+: CD45.1 in vs. CD45.2 **p < 0.01; percentage of granzyme B producing CD8 T cells in Klrk1+/+: CD45.1 in vs. CD45.2 *p < 0.05; percentage of NKG2D-expressing CD8 T cells in Klrk1+/+: CD45.1 in vs. CD45.2 *p < 0.05. All pies show proportion of T cells in Klrk1+/+ recipients. Pies in first column illustrate percentage of T cells producing IFNγ, granzyme B (GrB) or GM-CSF or expressing NKG2D according to the expression of CD45.2 (light gray) or CD45.1 (dark gray). Pies in second (CD45.1) and third (CD45.2) columns illustrate percentage of cells producing IFNγ, granzyme B (GrB) or GM-CSF or expressing.NKG2D within these two subsets.

