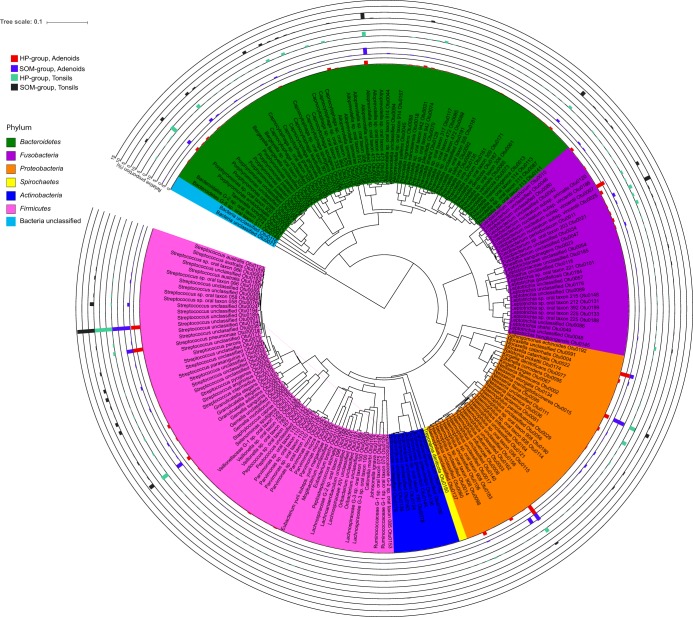
FIG 3.
Unweighted pair group method using average linkages (UPGMA) tree showing the phylogenetic relationship of the 200 most abundant OTUs across all samples. The tree file was generated using representative sequences from all 200 OTUs in MEGA 7 and visualized using iToL software. Each phylum is color highlighted, and the average percent abundancies of each OTU for the four groups are shown.

