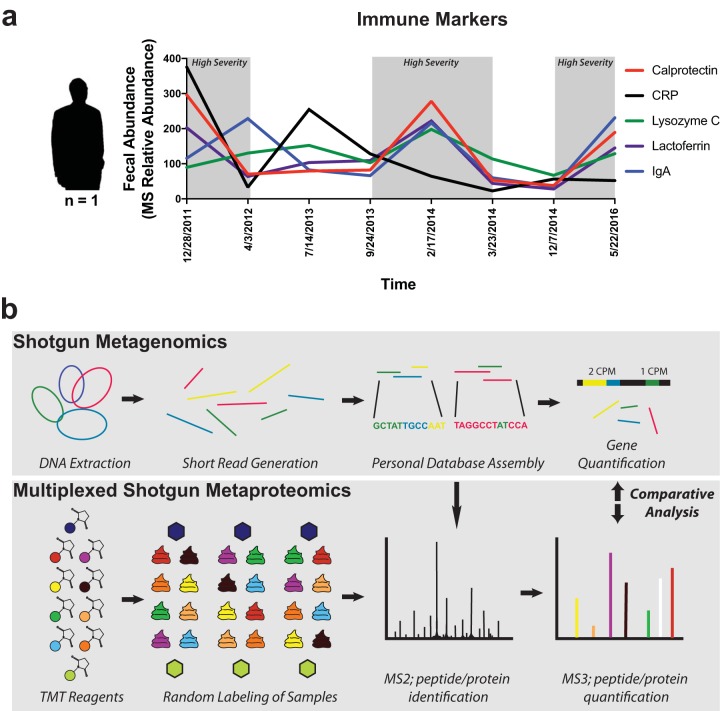
FIG 1.
Study design. (a) Immune markers associated with samples. Mass-spectrometry-based relative abundances of fecal calprotectin, CRP, lysozyme, lactoferrin, and secretory IgA are plotted as indicated on the left y axis for each of the eight time points in this study. (b) Workflow schematic describing omic methods. Shotgun sequencing and metaproteomic methods were performed in parallel for the analysis of eight selected samples. Both methods were performed in technical triplicate for evaluation of technical variability. Tandem mass tag (TMT) labeling of tryptic peptides was performed for three mass spectrometry experiments. Green and dark blue hexagons represent composite samples used as controls, while other colors represent the random labeling of samples using the remaining TMT reagents. Shotgun sequencing reads were combined and assembled into a shared reference database (Personal Database Assembly) for assigning gene counts (in counts per million [cpm]) and protein abundances. Data corresponding to MS1, which was used for precursor selection, are not depicted.

