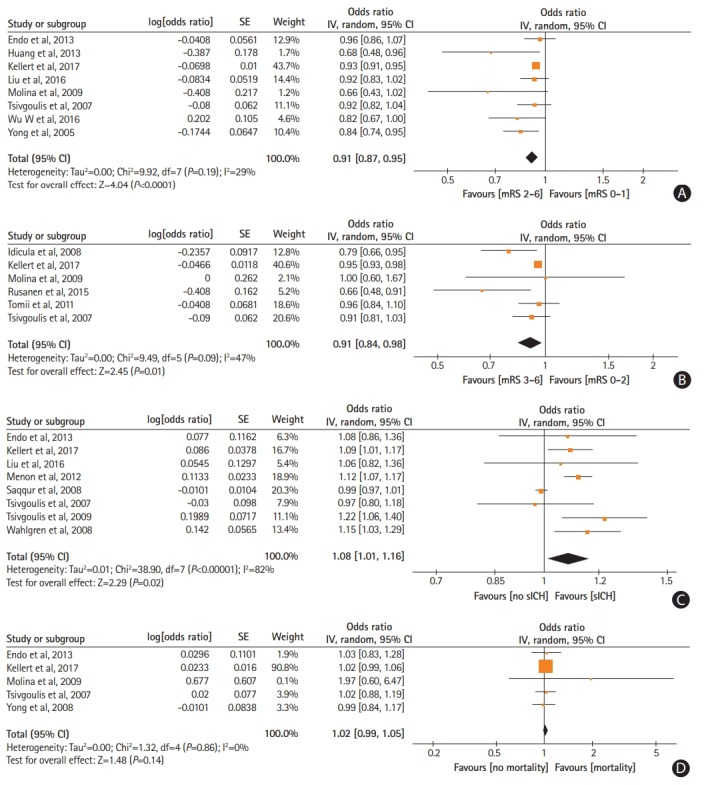
Figure 1.

Forest plot presenting the adjusted for potential confounders associations of pre-treatment systolic blood pressure levels with (A) favorable functional outcome, (B) functional independence, (C) symptomatic intracranial hemorrhage (sICH), and (D) mortality. SE, standard error; IV, intravenous; CI, confidence interval; mRS, modified Rankin Scale.
