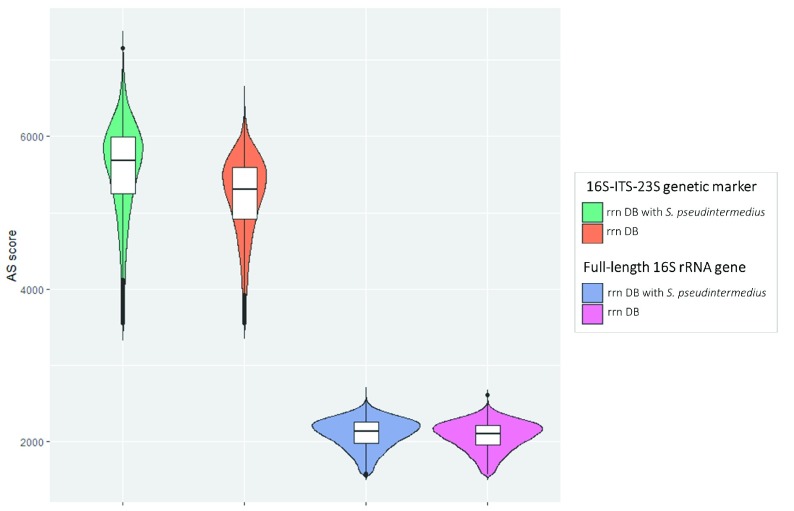
Figure 1. Violin plot representing the distribution of AS score for S. pseudintermedius isolate.
Alignment scores for each genetic marker were obtained using Minimap2 and either rrn DB or rrn DB with a reference added for S. pseudintermedius. The first two plots are for 16S-ITS-23S, whereas the second ones are for 16S rRNA.

