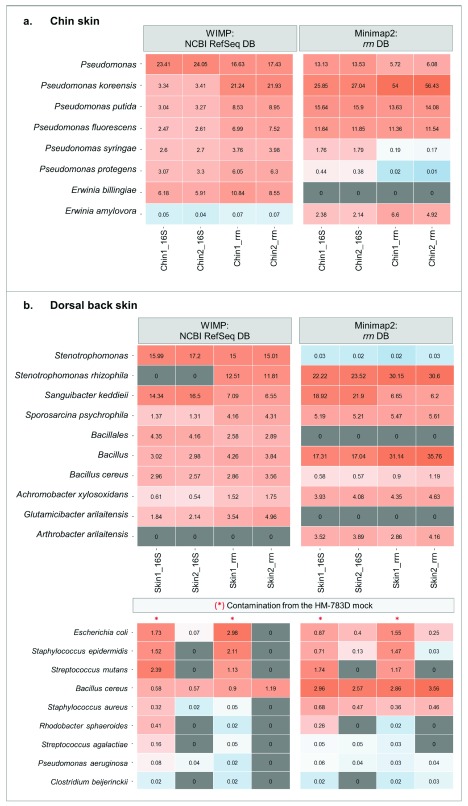
Figure 5. Microbiota composition of complex communities: skin samples of healthy dogs.
( A) Chin samples: heat map representing the relative abundance of the main bacterial species in chin samples using WIMP and Minimap2. ( B) Dorsal skin samples: heat map representing the relative abundance of the main bacterial species using WIMP and Minimap2. The lower heat map represents the remaining contamination from the previous run using HM-783D mock community within the same flowcell. Samples marked with a red line shared barcode with the mock community.

