Figure 5.
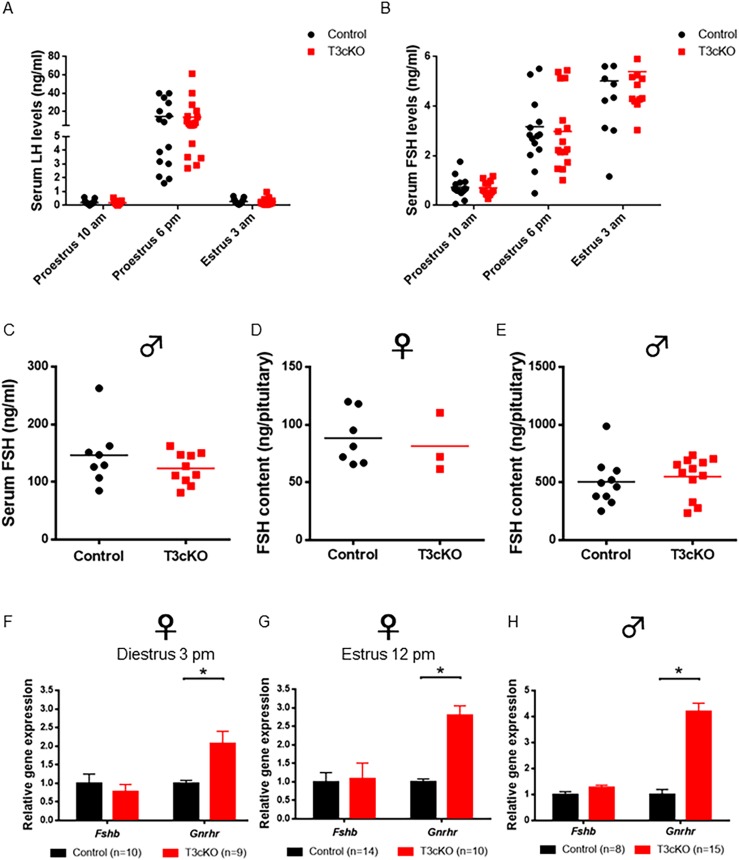
Normal serum and pituitary FSH levels in control and T3cKO females and males. (A) Serum LH and (B) FSH levels in control (black) and T3cKO females (red) sampled at 10 am and 6 pm on proestrus and 3 am on estrus morning are shown. LH was measured by in-house ELISA and FSH by Luminex (MPTMAG-49K; Millipore). (C) Serum FSH levels in adult males as assessed by multiplex ELISA are shown. Pituitary FSH content in 10-wk-old (D) female and (E) male mice, as assessed by RIA, is shown. Quantitative RT-PCR analysis of relative pituitary gene expression in 10-wk-old females at (F) diestrus (3 pm) and (G) estrus (12 pm), and in (H) males is shown. Data were analyzed by Student t test in each panel. Data in (F)–(H) are means (+SEM). *P < 0.05 was considered statistically significant.

