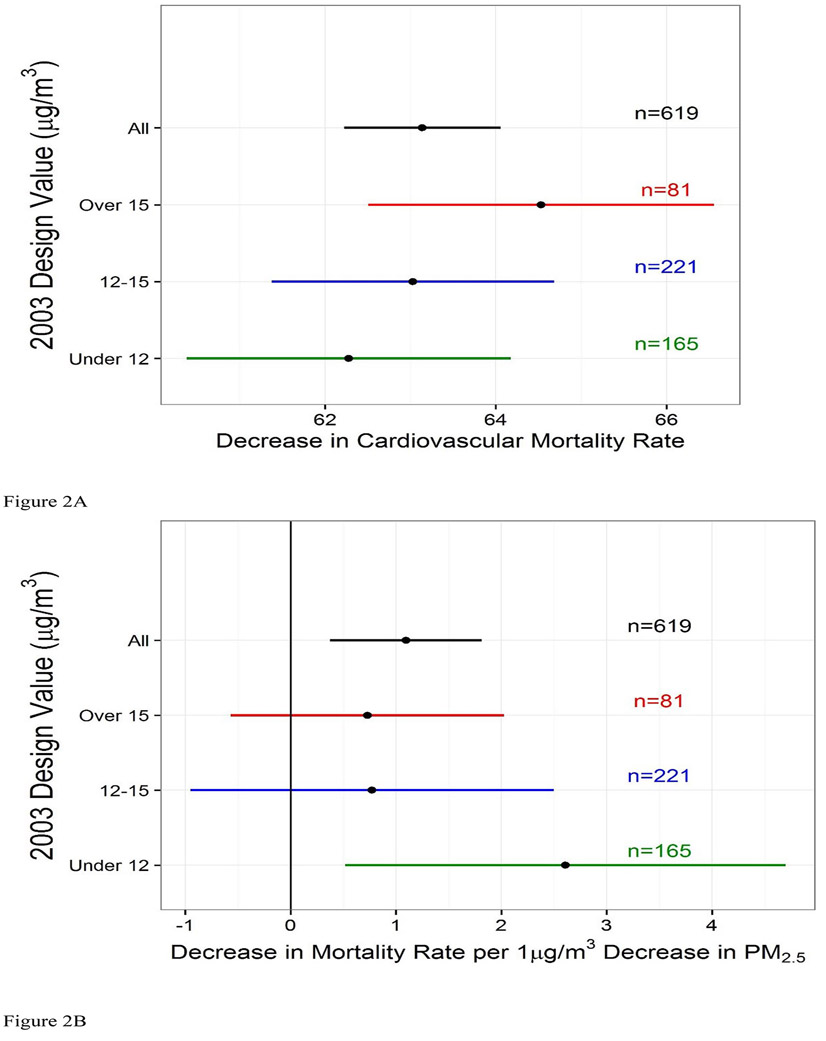
Figure 2.
(A) Effect estimate for an absolute decrease in cardiovascular mortality rate for all counties (n=619) and by counties with respect to 2003 Design Value (DV03) (n=467) —adjusted for confounders but not PM2.5 and corresponding 95% confidence intervals (B) Decrease in cardiovascular mortality rate effect estimate per unit decrease in PM2.5 for all counties and counties with 2003 DV greater than 15 μg/m3, between 12 and 15 μg/m3. and under 12 μg/m3 —adjusted for confounders and corresponding 95% confidence intervals.

