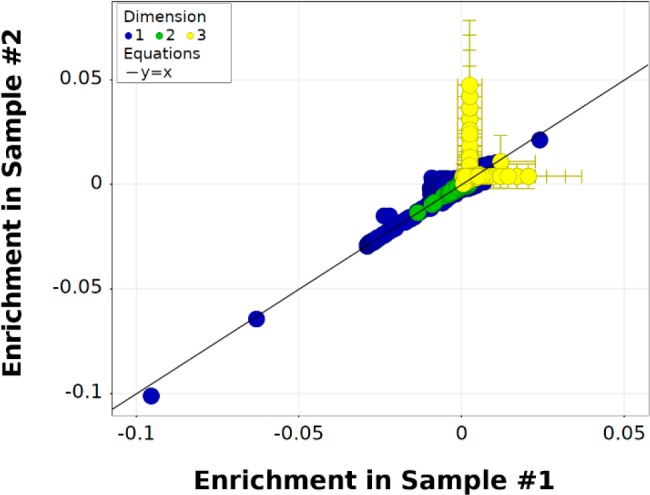
Figure 1.

Comparison of enrichment from two independently prepared naïve samples of the triazine DEL. Observed n-synthons are colored by their value of n (their “dimension”), and enrichment is measured as normalized z-scores with their 95% confidence intervals shown as error bars (some error bars are smaller than the data point radii). The y = x line corresponding to equal enrichment between the two samples is plotted for reference.
