
Figure 2.
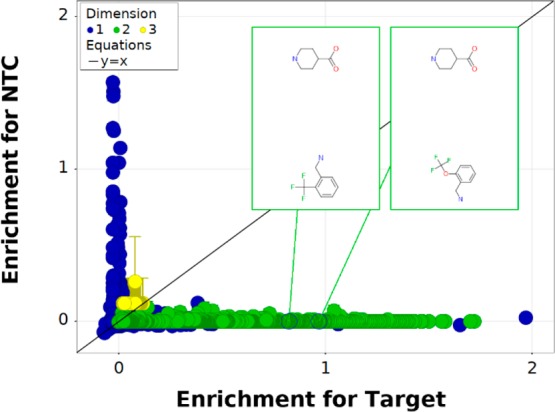
Comparative enrichment plot for a selection against sEH. Enrichment in the target data set is plotted along the horizontal axis against the measured enrichment for a control sample, an NTC, on the vertical axis. This DEL included compounds previously assayed for sEH inhibition by Thalji et al.30 as disynthons from cycles 1 and 3. Each point in the plot is a different n-synthon from the DEL, and the points highlighted in green correspond to analogues of the two most potent of the previously reported compounds. Both of these known inhibitor structures were observed in the target data but not the NTC, and the most potent inhibitors from the earlier publication were significantly more enriched in the target data set than the weaker inhibitors. The remaining points correspond to different combinations of amino acids in cycle 1 and amines in cycles 2 and 3 of the triazine DEL.