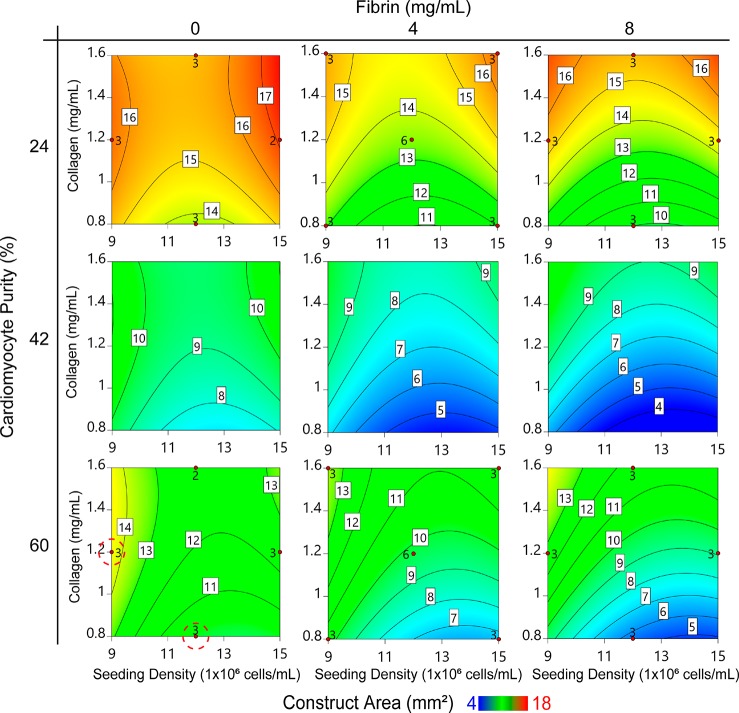
Figure 4.
Contour plots describing predicted construct compaction after 72 h of culture. Data is organized by cardiac purity (major y-axis), fibrin concentration (major x-axis), collagen concentration (minor y-axes), and seeding density (minor x-axes) for unpurified cardiomyocytes. Contour labels and colors indicate the predicted construct two-dimensional area in mm2 (white boxed labels) after 72 h of culture. Red dots and adjacent numbers indicate the number of empirical data replicates for a corresponding factor set, in positions prescribed by the Box-Behnken design. Red dashed circles indicate contractile groups.

