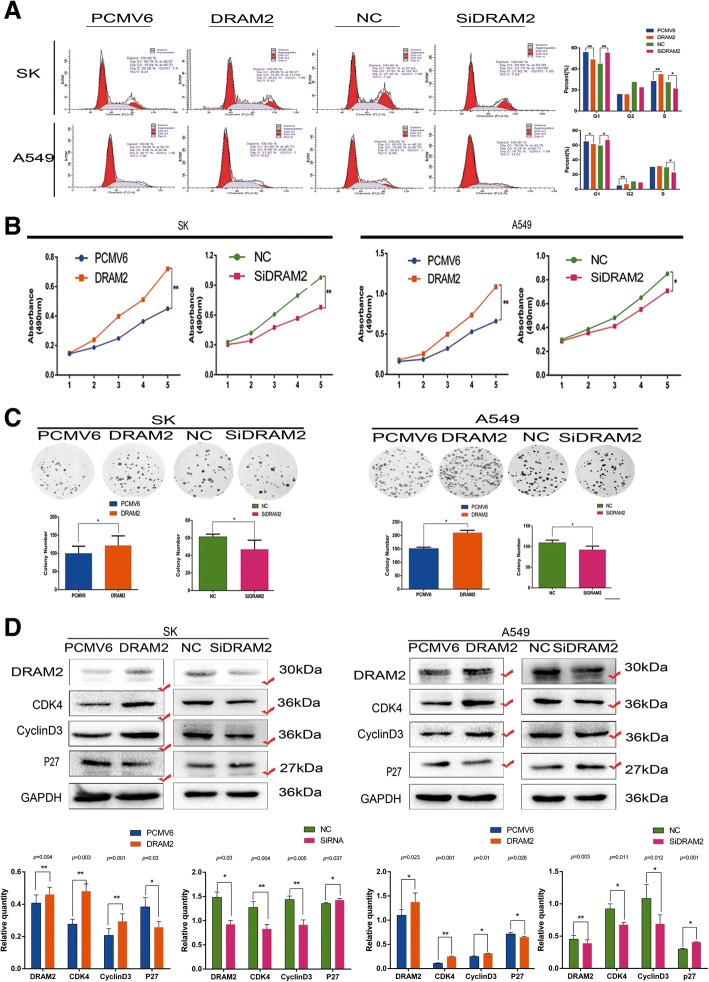
Fig. 4.
Expression of DRAM2 affected the proliferation of non-small cell lung cancer (NSCLC) cells. Upon DRAM2 overexpression and downregulation in SK and A549 cells, respectively, cell cycle analysis, MTT assay, and colony formation assay were performed. a. p-values of G1 phase of cell cycle analysis for A549 were: DRAM2 vs PCMV6, p = 0.022 and SiDRAM2 vs NC, p = 0.035; for SK, DRAM2 vs PCMV6 p = 0.003, SiDRAM2 vs NC, p = 0.016. p-values for differences in cells in G2 and S phase were also significant (data not shown); b. We compared MTT assay data on the fifth day, and calculated p-values for A549: DRAM2 vs PCMV6, p = 0.009; SiDRAM2 vs NC, p = 0.036; and for SK: DRAM2 vs PCMV6, p = 0.005; SiDRAM2 vs NC, p = 0.002; c. For colony formation assay in A549, DRAM2 vs PCMV6 p = 0.0164, and SiDRAM2 vs NC, p = 0.0462; for SK, DRAM2 vs PCMV6 p = 0.0465, and SiDRAM2 vs NC, p = 0.0310. *p < 0.05, **p < 0.01, ***p < 0.001 d. Effects of DRAM2 levels on the expression of proteins associated with cell proliferation in transfected SK and A549 cells. The gray level of the proteins were detected, the corresponding p value were provided at the top of the graphs and those changed proteins were marked.*p < 0.05, **p < 0.01, ***p < 0.001

