
Fig. 6.
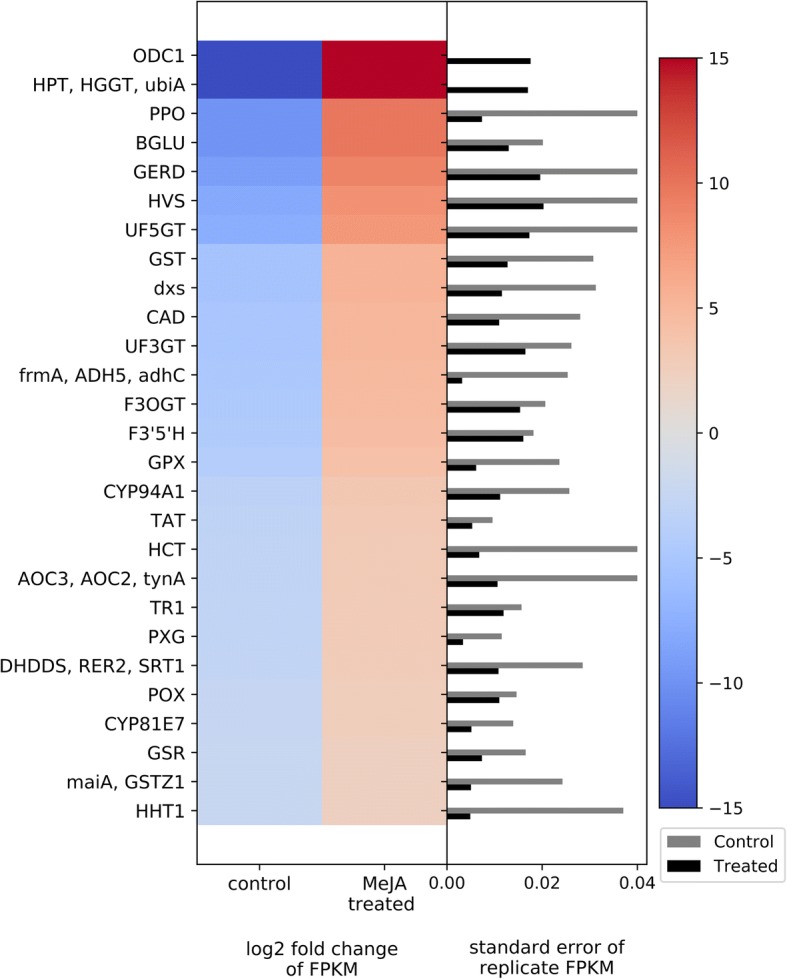
Heat map of DEGs related to secondary metabolite biosynthesis. The left side of the plot is the heatmap of log2 fold change of FPKM between all treated and control groups. The right side of the plot is the standard error for all replicates divided by the average FPKM for the control and treated groups