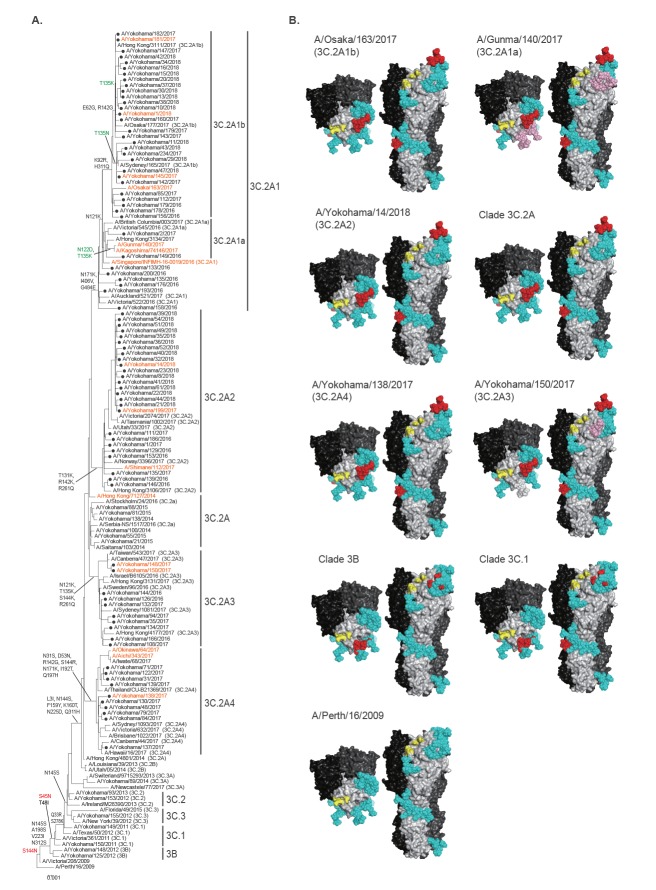
Figure 2.
(A) Phylogenic tree of the haemagglutinin (HA) sequences of isolatesa and (B) Alteration of N-linked glycosylation on H3-HAb, Yokohama, 2016/17 and 2017/18 influenza seasons
HA: haemaglutinin; NA: neuraminidase; PyMOL: Python-enhanced molecular.
aThe evolutionary history was inferred using the neighbour-joining method with Kimura distances. The viruses isolated in this study are indicated by black circles. The clade of the reference isolates, which are available in the GISAID EpiFlu database, is indicated in parentheses. Amino acid substitutions delineating major branches are shown. Amino acid changes involved in loss or gain of N-glycosylation are shown in green or red, respectively. The isolates used for antigenic analysis are shown in orange. A/Perth/16/2009 is defined as an outgroup.
bN-linked glycans present on all of the HAs on the HA trimer of A/Victoria/361/2011 (PDB ID code 4O5N) were added to the N-linked glycosylation sites in the crystal structure by using the GlyProt web server and were visualised by using the molecular graphics system PyMOL. Consensus sequences of clades 3B, 3C.1 and 3C.2A, and representative isolates of each clade, were used. Newly emerged N-linked glycans at N45, N144 and N158 are shown in red and the lost glycans at N122 and N133 are shown in light pink. Other N-linked glycans are shown in cyan. The receptor-binding site is shown in yellow.

