Fig. 2.
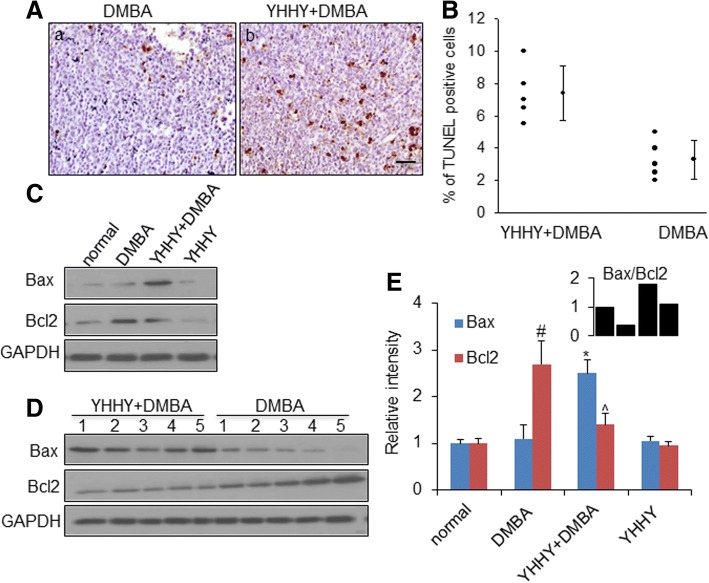
YHHY Decoction induced tumor cell apoptosis. a. Representative TUNEL staining images showing the apoptotic cells in tumor sections in a: DMBA-induced rat and b: YHHY treated DMBA rat. Apoptotic cells were detected by TUNEL reaction with In Situ Cell Death Detection Kit. TUNEL-positive cells contain dark-brown nuclei. Scale bar: 50 μm. b. Quantitative analysis of the % of TUNEL positive cells in the tumor sections. P = 0.0023, student t test. n = 5 animals per group. c. Representative Western blot images of Bax and Bcl2 in one tumor sample from each group. d. Expressions of Bax and Bcl2 in 5 individual tumors in the YHHY Decoction treated vs. DMBA control group. e. Quantification of the western blot analysis for Bax and Bcl2 in normal mammary glands (normal and YHHY groups) and mammary tumors (DMBA and YHHY+DMBA groups). # p < 0.05 vs. normal; * p < 0.05 vs. DMBA; ^ p < 0.05 vs. DMBA. The up-right corner graph showing the ratio of Bax/Bcl2 in each group

