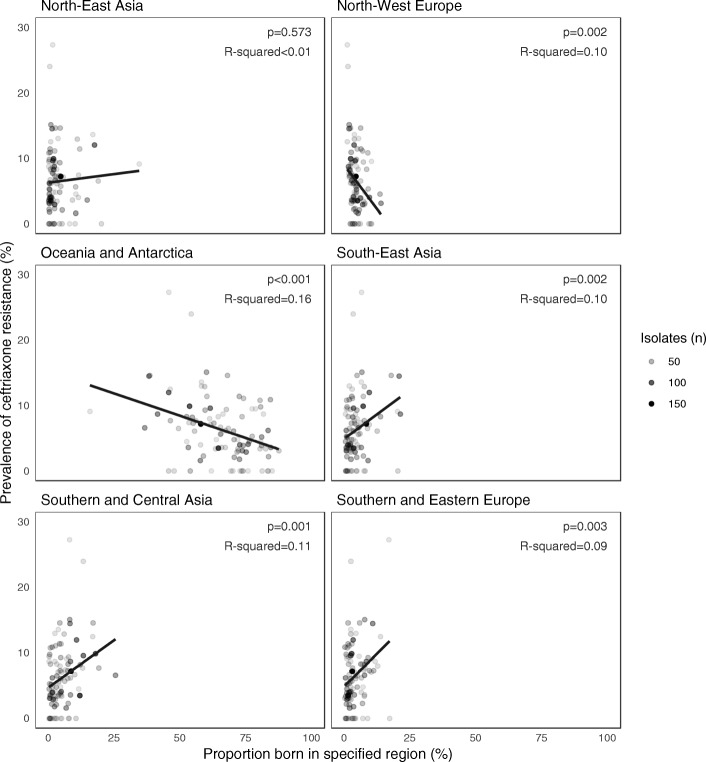
Fig. 3.
Association between prevalence of ceftriaxone resistance among urinary Escherichia coli isolates and region of birth of residents. Each point represents aggregate data from one postcode. Intensity of the point represents number of E. coli isolates represented (postcodes with less than 20 isolates have been omitted). Line of best fit computed using linear regression to predict prevalence of ceftriaxone resistance from proportion of residents born in the relevant geographic region, weighted by number of isolates. The p-values test the null hypothesis that the line of best fit has a coefficient (slope) of zero. R2 values represent the proportion of variation between postcodes in prevalence of ceftriaxone resistance that is explained by the model

