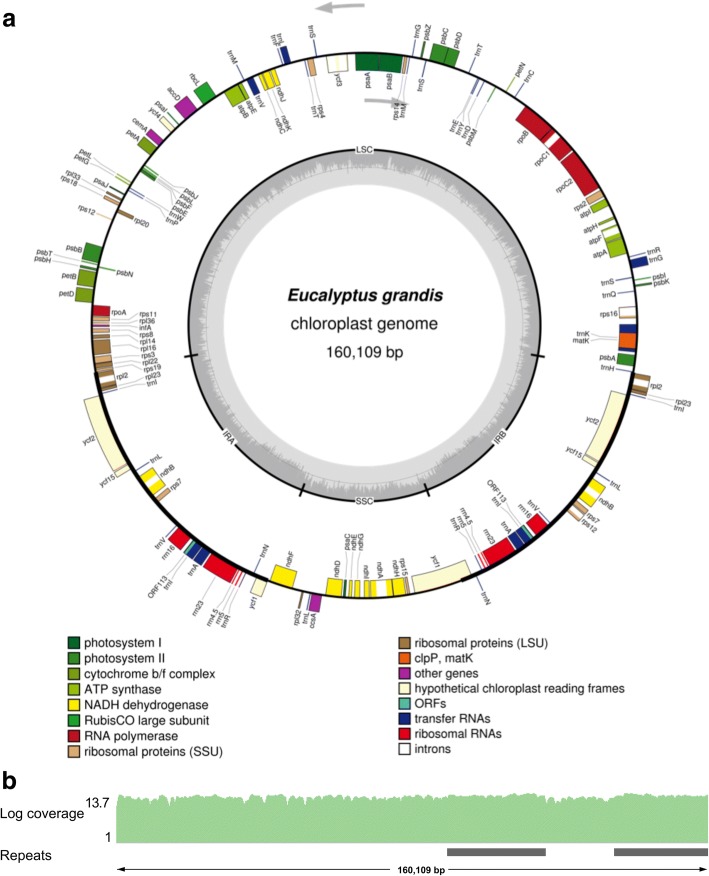
Fig. 2.
Plastid genome of E. grandis. a. Genomic features are shown facing outward (positive strand) and inward (negative strand) of the circular E. grandis plastid genome. The colour key shows the functional class of the plastid genes, and introns are shown in white. The GC content is represented in the innermost circle with the inverted repeat (IR) and single copy (SC) regions indicated. The figure was generated in OGDraw [77]. b. Genome coverage of E. grandis WGS reads in log2 scale (Log coverage) across the plastid genome. WGS reads were mapped with Bowtie 2 [78] and visualized in IGV [79]. The position of the plastid inverted repeat regions are shown below (Repeats) in grey

