Fig. 3.
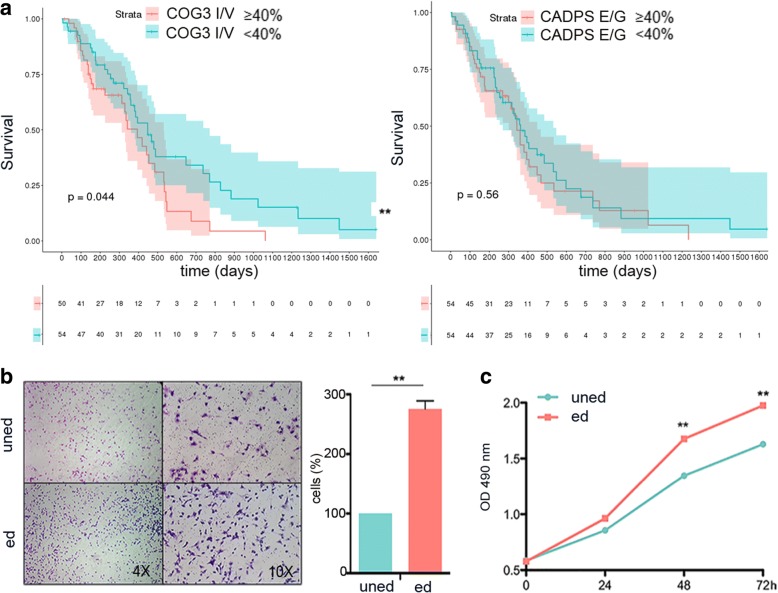
Clinical relevance of editing at COG3 I/V recoding site. a Kaplan-Meier curves representing the survival probability of GBM patients stratified by COG3 I/V (104 samples) and CADPS E/G (108 samples) editing levels respectively. Log-rank test, COG3 p value = 0.044, CADPS p value = 0.56. The red line represents high editing frequency (≥ 40%), the green line represents low editing frequency (< 40%). b Migration assay of glioblastoma cells (A172) expressing unedited COG3 (uned) and edited (ed) COG3 was performed 24 h post-seeding. Representative photographs of migrated cells are shown (× 4 and × 10 magnifications). Migrated cells were stained with Diff-Quick and counted. Histograms show the migration ability of ed. COG3 expressing cells relative to the uned COG3 (fold increase ± SD, n = 3) **p ≤ 0.01 (two-sided t test). c Proliferation (MTS assay) of glioblastoma cells (A172) infected with unedited or edited COG3 (mean ± SD, n = 3) **p ≤ 0.01 (two-sided t test)

