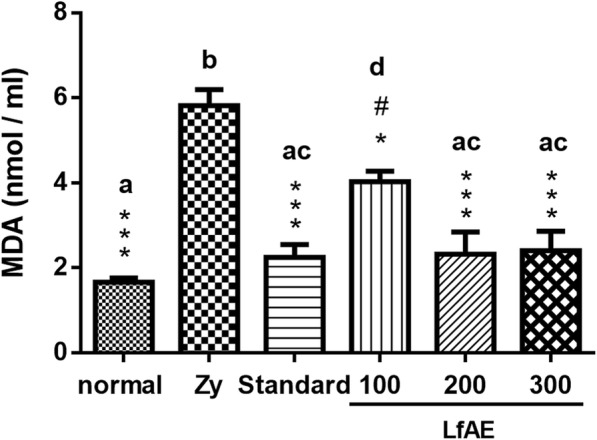
Fig. 5.

Effect of LfAE (100, 200 and 300 mg/kg) on the levels of malondialdehyde in the zymosan-induced arthritis model. Data are expressed as mean ± SD (One-way ANOVA, Tukey-Kramer test, n = 6 per group). Letters (a, b, c, d) refer to the result of Tukey-Kramer post hoc test. Groups that do not share a letter have a mean difference that is statistically significant. *(p < 0.05), ***(p < 0.001) vs zymosan control group (Zy); #(p < 0.05) vs normal control group
