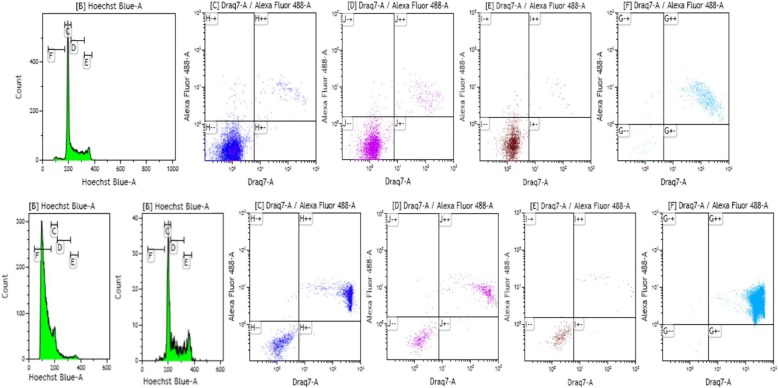
Fig. 2.
Cell cycle analysis of the NGP neuroblastoma cell line. Top row: non-treated NGP cell line. Bottom row: treated (20 μM PRIMA-1MET) NGP cell line. Gates: Green: cell cycle (20 μM Hoechst) c: G1 phase (dark blue); d: S phase (purple); e: G2/M phase (brown); f: sub-G1 phase (light blue). Cells in gates C, D, E, and F are distributed according to DRAQ7 and Cas3/7 (AlexaFluor 488) intensity. −/− live cells with stable membrane; −/+ live cells with triggered Cas3/7; +/+ dead cells with triggered Cas3/7 and nonfunctional membrane; +/− dead cells without activated Cas3/7 but with nonfunctional membrane. Results demonstrate that cells treated with PRIMA-1MET die in all phases of the cell cycle and that PRIMA-1MET activates apoptosis with similar intensity to non-treated control cells undergoing apoptosis

