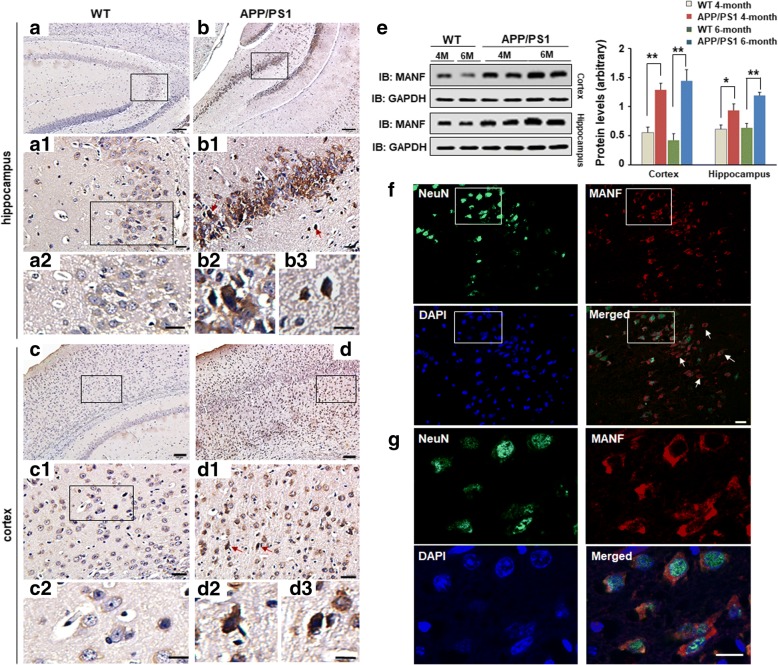
Fig. 3.
MANF expression in the brains of the APP/PS1 transgenic mice. DAB staining of MANF in hippocampus (a, b) and cortex (c, d) of WT mice (a, c) and APP/PS1 mice (b, d) aged 6 months. Noted the upregulated MANF expression in the brains of APP/PS1 mice (b1, d1) compared to WT mice (a1, c1). Panels a2 and c2 are magnified images in a1 and c1, respectively. Panels b2, b3, and panels d2, d3 are enlarged images in b1 and d1 (red arrows indicated) respectively, to show cellular distribution of MANF in hippocampus and cortex. Scale bar = 100 μm (a–d) or 20 μm (a1, a2, b1, b2, b3, c1, c2, d1, d2, and d3). (e) The levels of MANF in the hippocampus and cortex of 4- and 6-month-old male APP/PS1 mice and age- and sex-matched wild-type (WT) mice, respectively. Quantitative analysis of MANF levels is shown in the right panel. Data are presented as mean ± SD, four mice were used for each group. *P < 0.05, **P < 0.01. (f) Representative images of MANF (red) and NeuN (green) immunofluorescence labeling in the cerebral cortex of the APP/PS1 transgenic mice. The nuclei were stained with DAPI (blue). (g) The magnified images in f to show the colocalization of MANF and NeuN. Scale bar = 10 μm. M month, WT wild-type

