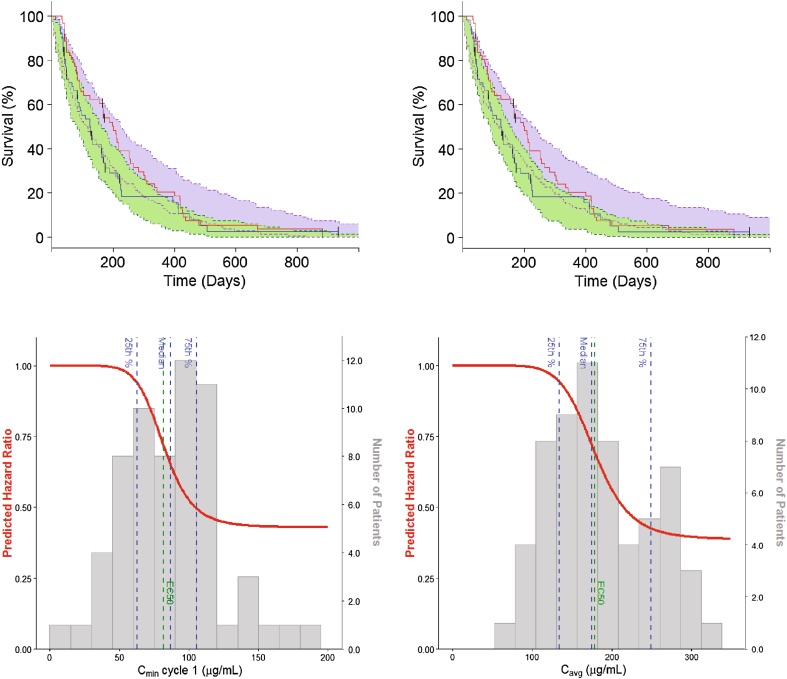
Fig. 2.
Visual predictive check and model prediction of the progression-free survival models. a Left graph is the VPC of the Cmin1-based PFS model. Right graph is the VPC of the Cavg-based PFS models. The shaded areas indicate the predicted PFS in the control (green) and experimental (blue) arm; the solid blue lines describe the corresponding observed PFS signals. Cavg = average concentration over patient’s entire treatment. b Progression-free survival as predicted by Cmin1-based model (left panel) and the Cavg-based model (right panel). The solid red lines describe the change in HR as a function of Cmin1 and Cavg; the grey histograms describe the distribution of olaratumab Cmin1 and Cavg in the study JGDG experimental arm together with their quartiles (dashed blue lines); the green dashed lines indicate ECmin150 and ECavg50. Cmin1 = trough serum concentration at the end of Cycle 1. ECavg50 = olaratumab Cavg yielding a 50% decrease in the baseline hazard. ECmin150 olaratumab Cmin1 yielding a 50% decrease in the baseline hazard, HR hazard ratio, PFS progression-free survival, VPC visual predictive check

