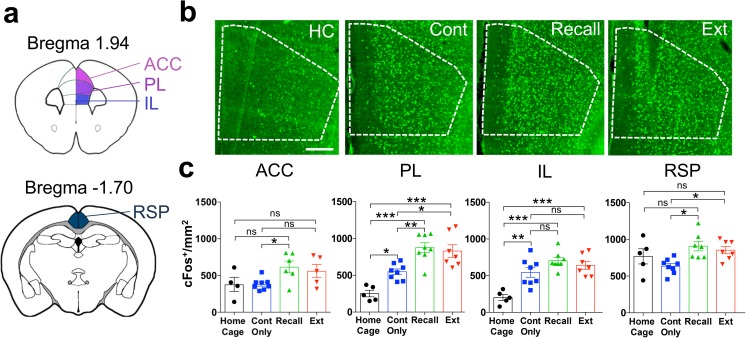
Fig. 2.
cFos activation in cortex. a Schematic representation of the cortical structures selected for cFos density analysis. b Representative pictures of cFos immunohistochemistry in the PL. Scale bar = 200 μm. c cFos density in “Home Cage,” “Context Only,” “Recall” and “Extinction” groups in the ACC (ANOVA, F(3, 24) = 3.3, P < 0.04, n = 5–8), PL (ANOVA, F(3, 24) = 18.1, P < 0.0001, n = 5–8), IL (ANOVA, F(3, 24) = 13.7, P < 0.0001, n = 5–8), and RSP (ANOVA, F(3, 24) = 4.4, P = 0.01, n = 5–8). *P < 0.05; **P < 0.01; ***P < 0.001, by Sidak post-hoc tests

