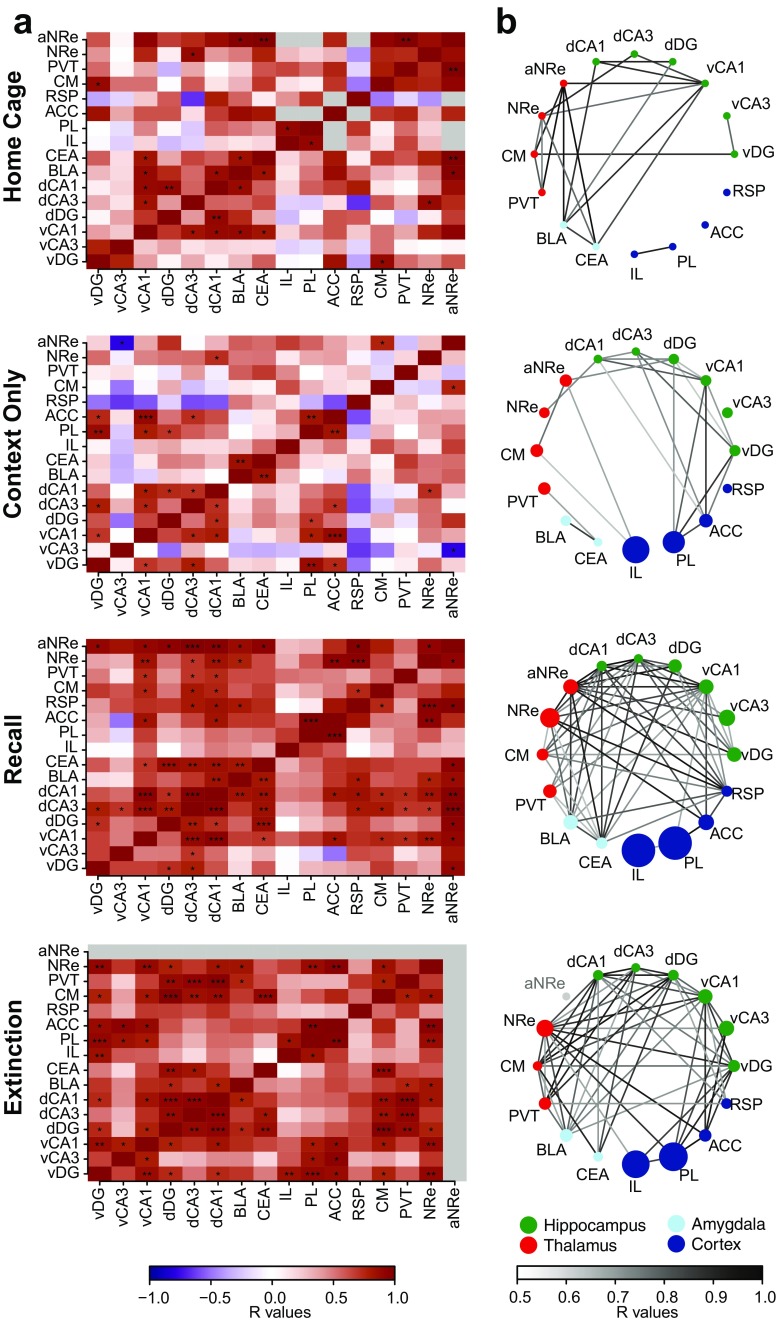
Fig. 6.
Cross-correlation and network connectivity analysis of cFos activationin in (from top to bottom) the “Home Cage”, “Context only”, “Recall” and “Extinction” groups. a Pearson correlation matrices showing inter-regional correlations for cFos activation density. Axes represent brain regions. Colors reflect Pearson correlation coefficients (scale, below) and labels within squares correspond to P values of correlations. *P < 0.05; **P < 0.01; ***P < 0.001. R values that were calculated using fewer than four pairs of cFos densities are shown as gray boxes. b Network connectivity graphs indicate only the strongest correlations (r value ≥ 0.5, P value ≤ 0.1, n value > 4). Connecting line transparency represents correlation strength (r value. Scale, below). Regions are color-grouped by major brain subdivisions and node size is proportional to the fold-change of cFos activation density between the indicated experiment and Home cage

