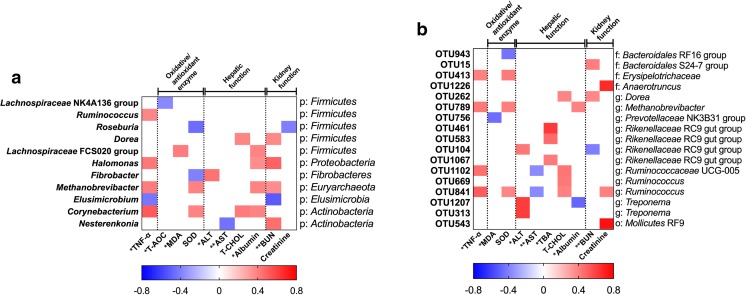
Fig. 4.
Correlation analysis of microbiota (genus and OTU levels) and inflammatory cytokine, oxidation reduction, and hepatorenal function. a Genus level. b OTU level. The color is according to the Pearson coefficient distribution: red represents a positive correlation (P < 0.05), blue represents a negative correlation (P < 0.05), and white shows that the correlation was not significant (P > 0.05). *Significantly affected by dietary copper level (P < 0.05); **Significantly affected by dietary copper level (P < 0.01); p, phylum; o, order; f, family; g, genus

