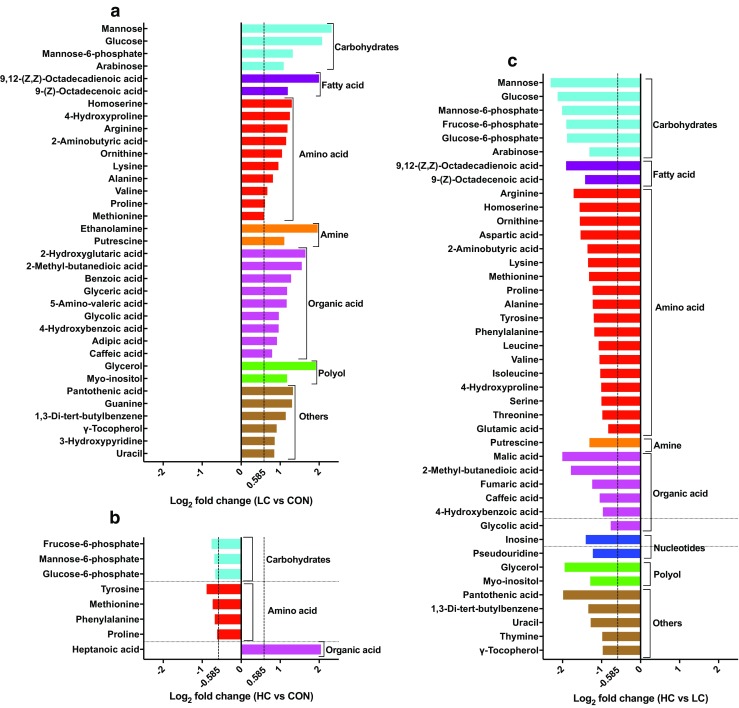
Fig. 5.

Fold change of significant fecal metabolites. Significant metabolites accountable for class discrimination with VIP > 1 and P < 0.05 are listed. The fold change was calculated using the normalized relative abundance of metabolites between each group: a LC vs. CON; b HC vs. CON; and c HC vs. LC. The threshold was 0.585; enrichment > 0.585, reduction ≤ -0.585
