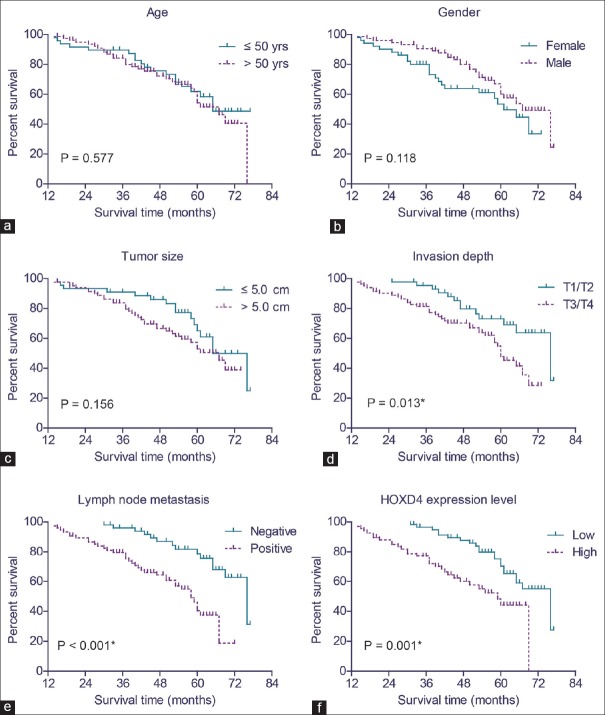
Figure 3.
Analyses of the overall survival of gastric adenocarcinoma patients. The overall survival curves were plotted by Kaplan–Meier method and tested with log-rank test, based on patients’ age (a), gender (b), tumor size (c), tumor invasion depth (d), lymph node metastasis (e), and homeobox D4 protein expression level (f), respectively. *P < 0.05 by log-rank test

