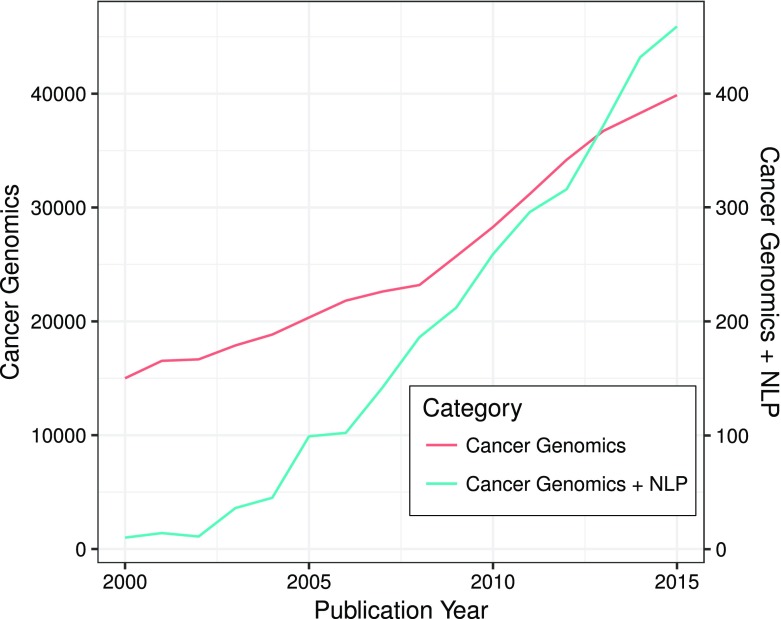
Fig. 2.
Publication number plotted against publication year. In this figure, two y-axes have been plotted. One y-axis represents the number for papers related to “Cancer Genomics”. The other y-axis represents the number for papers related to “Cancer Genomics + NLP”. The x-axis represents the publication year

