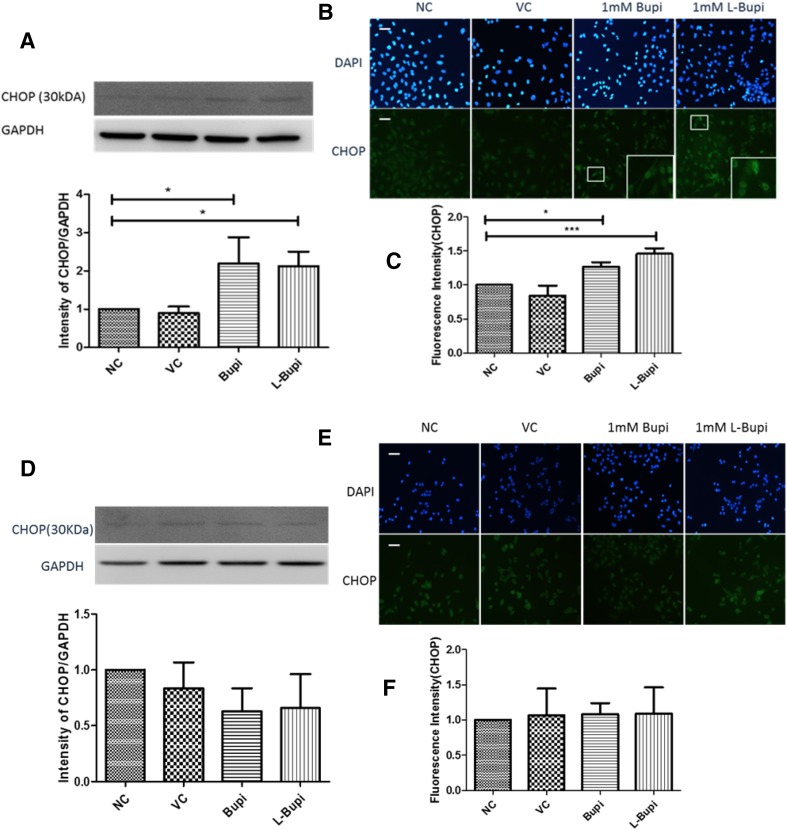
Fig. 4.
Expression of CHOP after application of bupivacaine and levobupivacaine. Representative western blots and band density analysis of CHOP in a Caco2 cells and d A375 cells. Grey scale of intensity values expressed as ratio relative to GAPDH. Representative immunofluorescence images of CHOP in b Caco-2 cells and e A375 cells (×20 magnification; nuclei counterstained with DAPI; scale bar = 50 µm). Immunofluorescence intensity of CHOP in c Caco-2 cells and f A375 cells across different treatment groups (n = 4, data shown as mean ± SD; *p < 0.05; NC naïve control, VC vehicle control, Bupi 24 h treatment of 1 mM Bupivacaine, L-Bupi 24 h treatment of 1 mM Levobupivacaine)

