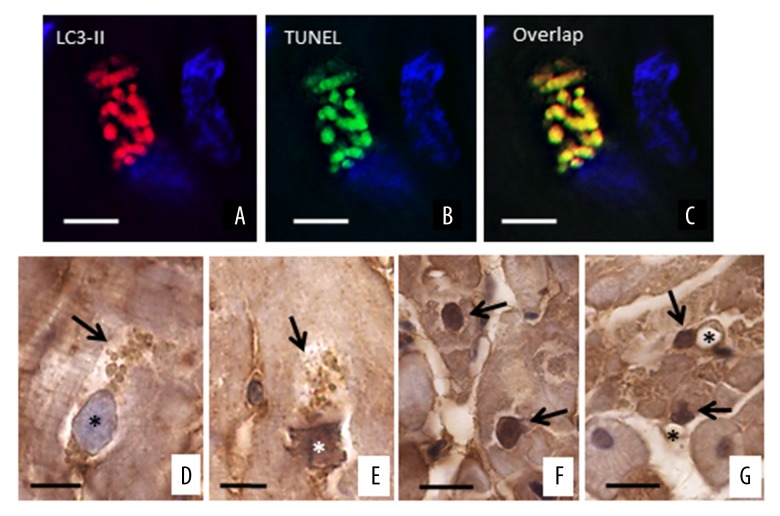
Figure 5.
Co-localization of autophagy and apoptosis. (A–C) LC3 positive areas co-localize with the TUNEL, suggesting that both autophagy and apoptosis are present simultaneously in damaged cells. The sections were stained with Sudan black to delete the auto-fluorescence of lipofuscin. The nuclei are in blue. (D–G) Representative progression of apoptosis (ABC-diaminobenzidine IHC for active-C3) in failing heart. (D) the nuclear rim appears to be slightly irregular and a slight staining is observed on the inner surface of the nuclear envelope (asterisk). At the nuclear poles there are numerous large vesicles with pale staining(arrow). (E) In the later stage of autophagic alteration, the vesicles (arrows) seem to originate from nucleus, are small and show a more intense staining. The nuclear pole from which the vesicles seem to originate appears truncated. Inside the IHC staining is moderate (asterisks). (F) Intense anti-C3 stained nuclei of cardiomyocytes from heart failure patients. These nuclei did not show “bite signs”, or cytoplasmic vesicles. (G) Non-cardiomyocytes cell nuclei (arrow) near at vessel (asterisk) were sometime seen in heart failure patients. Scale bar=10 μm. IHC – immunohistochemistry; C3 – cleaved-caspase-3.

