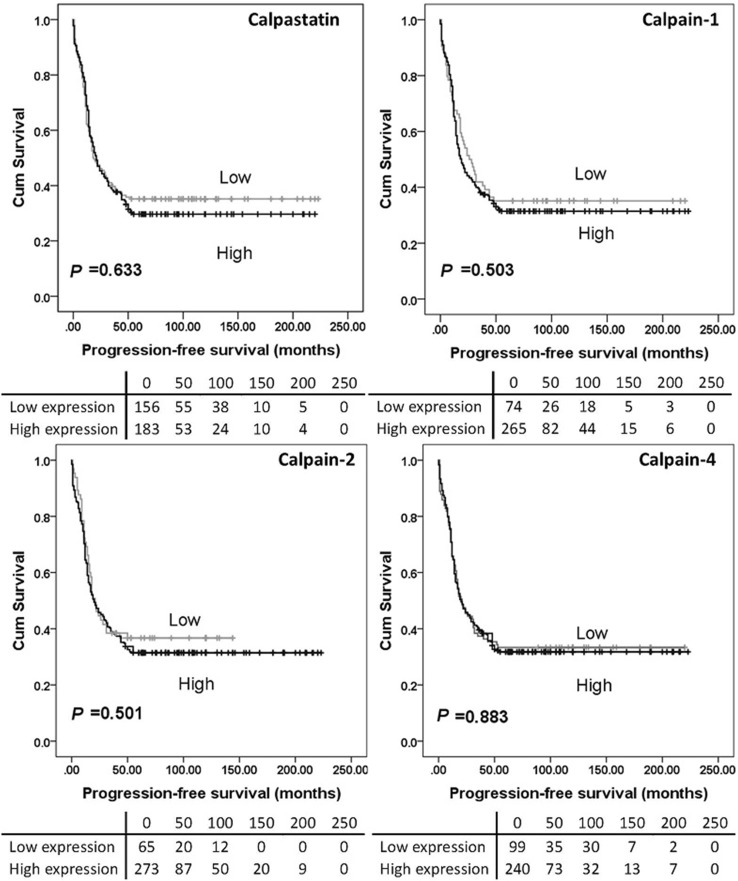
Fig. 3.
Kaplan–Meier survival curves of calpastatin and calpain-1, -2 and -4 expression, and progression-free survival. Analysis of progression-free survival shows the impact of calpastatin, and calpain-1, -2 and -4 in ovarian cancer patients. Significance was determined using the log-rank test. The tables shown below the Kaplan–Meier survival curves listed the number of patients at risk at the specific months. High expression—black line, low expression—grey line

