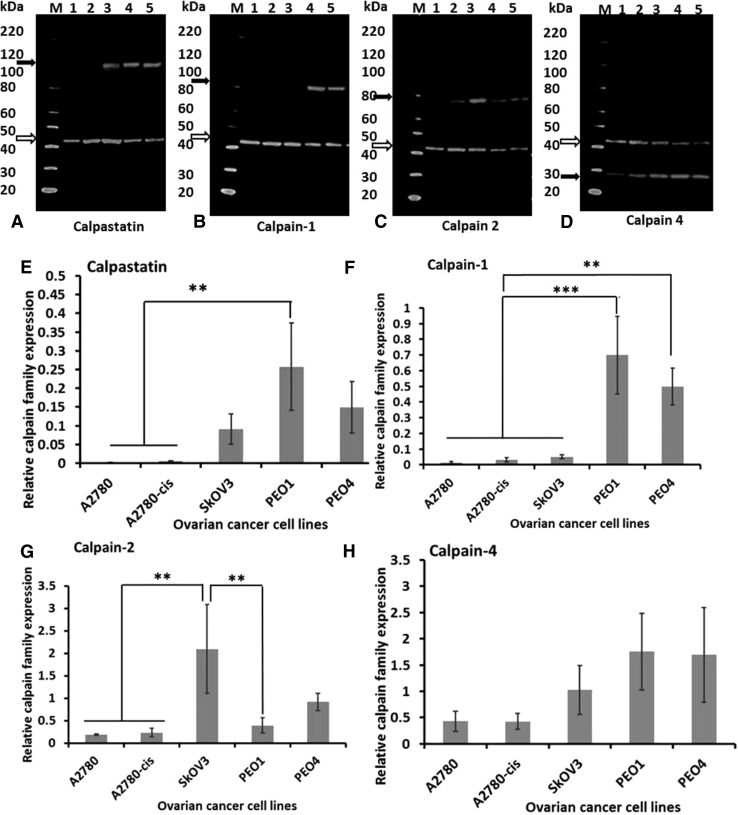
Fig. 5.
Western blot quantification of protein expression in ovarian cancer cell lines. Representative western blots of three independent experiments are presented. Open arrows indicate β-actin (42 kDa) which was used as the loading control. Black arrows indicate a calpastatin (between 100 and 120 kDa), b calpain-1 (82 kDa), c calpain-2 (80 kDa) and d calpain-4 (28-kDa), respectively. Lane M: protein marker, Lane 1: A2780, Lane 2: A2780-cis, Lane 3: SKOV3, Lane 4: PEO1, and Lane 5: PEO4. Graphical representation of protein levels of e calpastatin, f calpain-1, g calpain-2 and h calpain-4 in ovarian cancer cell lines relative to β-actin. Data represent the average ± standard deviation of three independent experiments. Statistical significance was determined by one-way ANOVA and is indicated by asterisk. *P < 0.05, **P < 0.01 and ***P < 0.001

