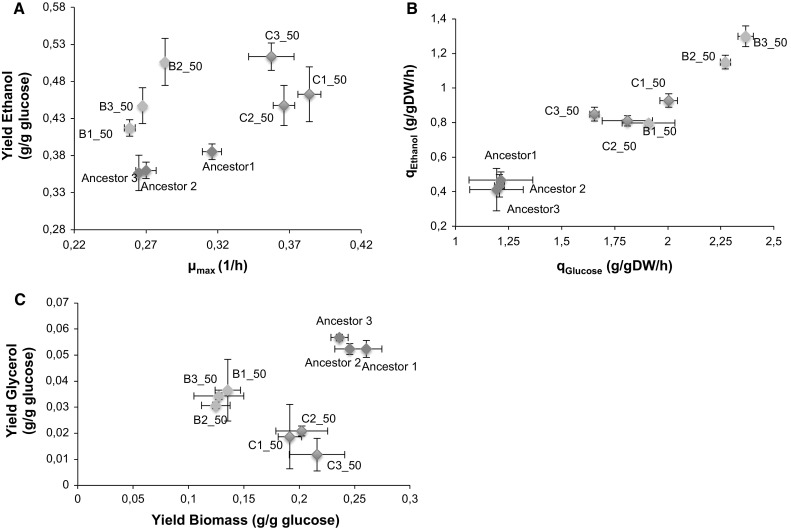
Fig. 6.

Fermentative capacity of the thermotolerant strains. The plots show that A growth rates of isolates from evolution line C (blue marker style) were faster than the ancestral strain but those from line B (green marker style) were not different from that of the ancestor (red marker style). Both evolved lines produced more ethanol that their ancestor, B the maximum glucose consumption rate and ethanol production rates were higher than the ancestral strain but C accumulated lower glycerol and biomass
