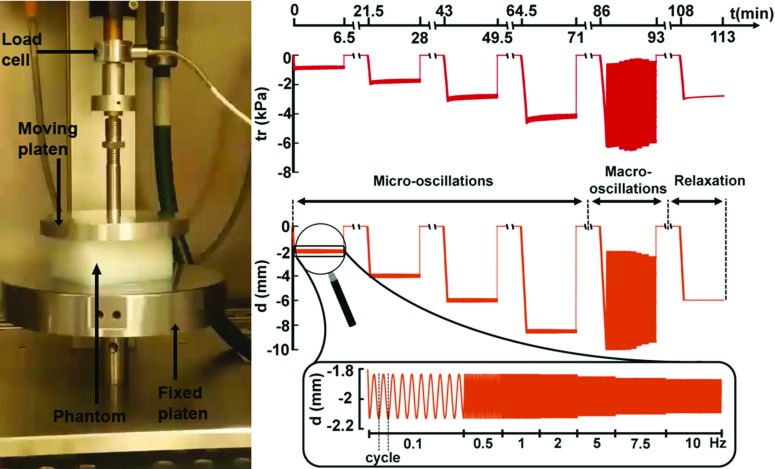
Fig. 2.
Illustration of experimental setup, protocol and data in rheological tests. (Left) Phantom in the rheological instrument. The moving platen is compressing the phantom and oscillates vertically, while the loading cell records the force. (Right, top) The traction measurements in one phantom for the six tests: four micro-oscillations and one macro-oscillation (sweeping over frequencies) and a relaxation test. (Right, bottom) Platen displacements, corresponding to phantom compression levels. Zoomed panel: exemplification of a micro-oscillatory test displacements, showing the frequency sweep; illustration of a cycle in the lowest frequency regime—one period, starting from the lowest point in the compression

